March 4, 2026 · Gaurav Radadiya
Most Shopify merchants forecast inventory by looking backward: last month’s sales, last quarter’s velocity, last season’s trends. The problem is that by the time historical data confirms high demand for a product, you are often already out of stock or dangerously close to it.
Here is the irony. Predictive restocking does not require a new forecasting tool. It requires reading a signal you are already collecting. Every notify-me signup on your product pages is a customer declaring: “I want this product. I expect it to sell out before I can buy it.” Collectively, those signups are a demand forecast, generated in real time, at zero cost, from actual purchase-intent buyers.
A previous article covered using waitlist data to size restock orders after a stockout has already occurred. This article goes one step earlier: using accumulating signup velocity as a demand-driven restocking signal to trigger a reorder before you run out.
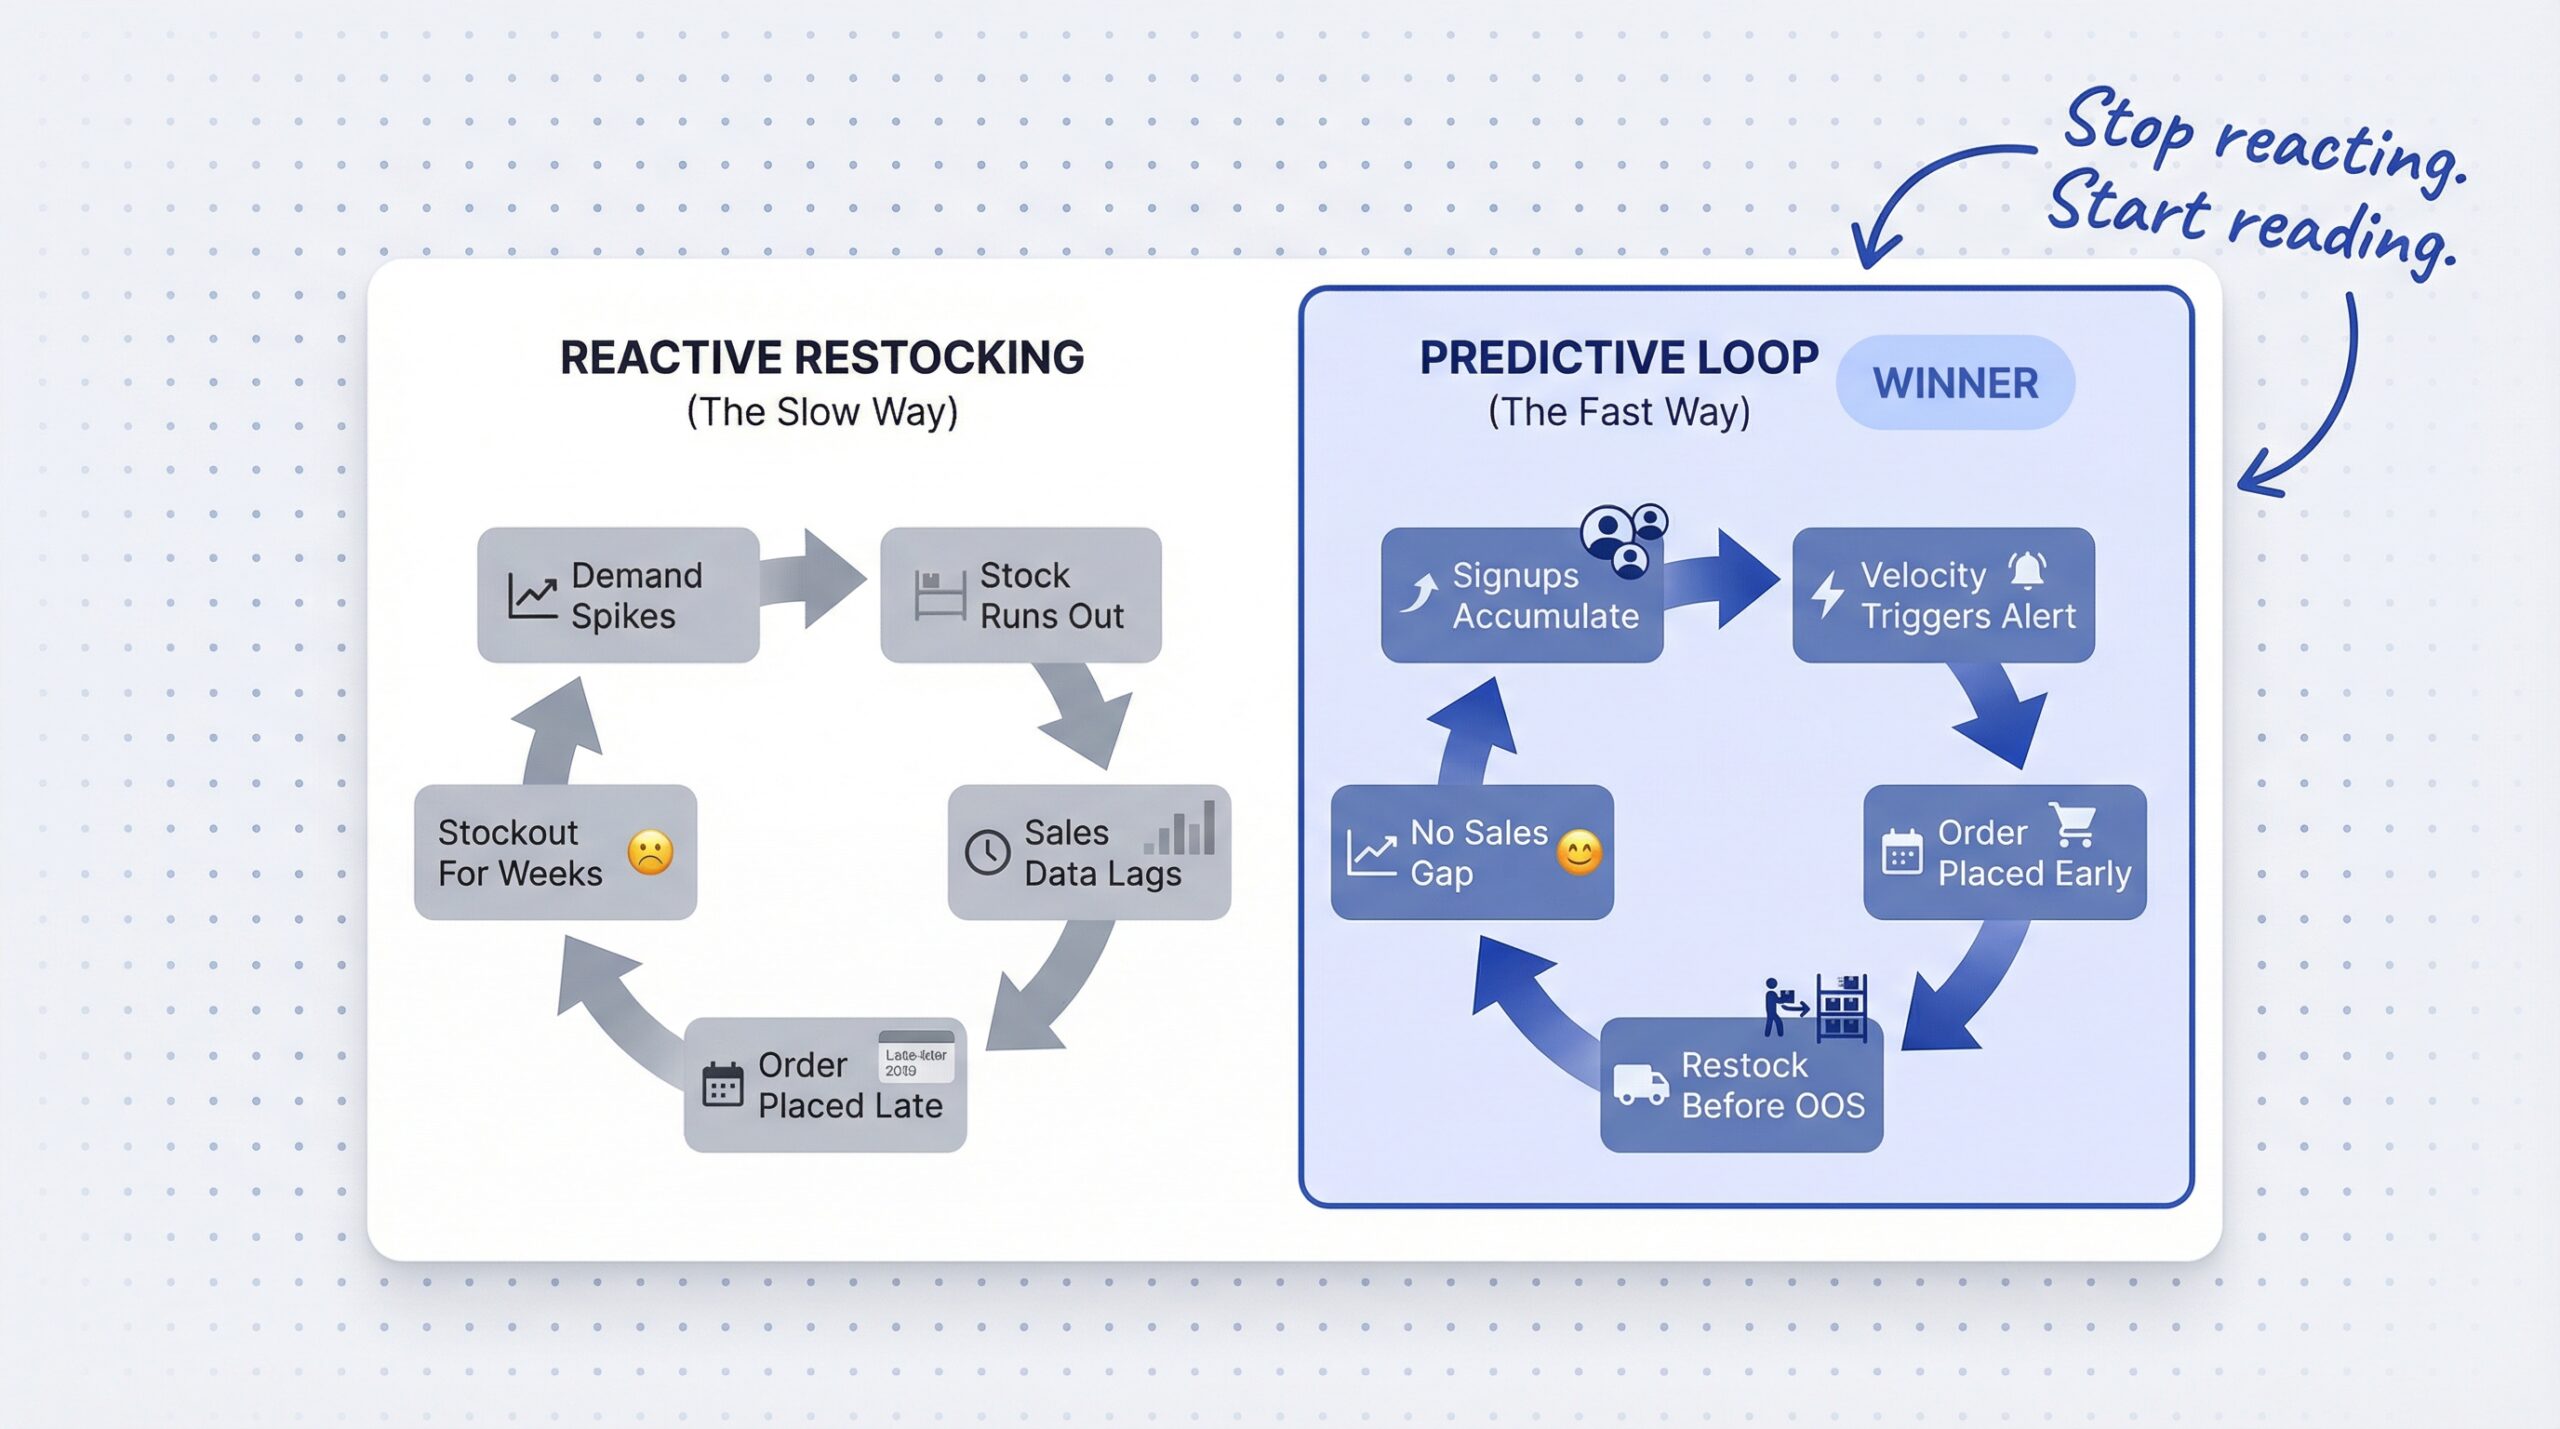
Reactive restocking fails because it relies on sales history to confirm demand that has already happened. By the time your spreadsheet tells you a product is trending, you are already low on stock or completely out.
The standard loop looks like this: demand spikes, stock runs low, sales data catches up a few days later, you place an order, your supplier ships in two to three weeks, and your product page shows “out of stock” for the entire gap. That gap is where revenue disappears.
60% of online brands face a stockout situation every single week (Opensend inventory stockout rate data, 2024). And the damage compounds. Inventory distortion, the combined cost of stockouts and overstocks, cost global retailers $1.77 trillion in 2023, with out-of-stocks alone accounting for $1.2 trillion of that total (IHL Group’s 2023 inventory distortion research, 2023).
The root cause is structural: historical sales data cannot see demand that has not purchased yet. A customer who signed up for a notify-me alert is expressing demand that sales history will never capture. 98% of Shopify merchants report difficulty aligning inventory and production with changing consumer demand (Katana Cloud Inventory’s 2024 Shopify merchant survey, 2024). That difficulty exists because the standard model ignores the most honest demand signal available.
Your notification app is already generating three demand signals that most merchants never use for inventory planning.
Signal 1: Signup velocity on in-stock products. If a product still has 150 units but is collecting 20-30 new notify-me signups per week (typically because some variant SKUs are already out of stock), those signups represent demand that may exceed your remaining stock within your supplier lead time. Signup velocity on a product with inventory remaining is an approaching-stockout indicator.
Signal 2: Signup acceleration. A sudden spike in signups for a product that was collecting few signups before is a trend signal, not just a demand signal. Someone posted it on TikTok. A competitor discontinued a comparable SKU. A seasonal moment is arriving earlier than expected. Signup acceleration is an early-warning signal for a demand event you have not forecasted.
Signal 3: Cross-SKU clustering. When multiple related SKUs in the same category start collecting signups simultaneously, that is a category-level demand shift, not a product-level one. You may need to restock an entire product line, not just one variant.
These signals are uniquely valuable because they are first-party (collected by your own store), voluntary (the customer chose to sign up), product-specific (tied to a single SKU), and purchase-intent-qualified. 48% of shoppers are willing to sign up for restock notifications when they encounter an out-of-stock item (Opensend, 2024). These are not casual browsers. They are buyers.
| Signal Type | Purchase Intent | Actionable for Inventory? |
|---|---|---|
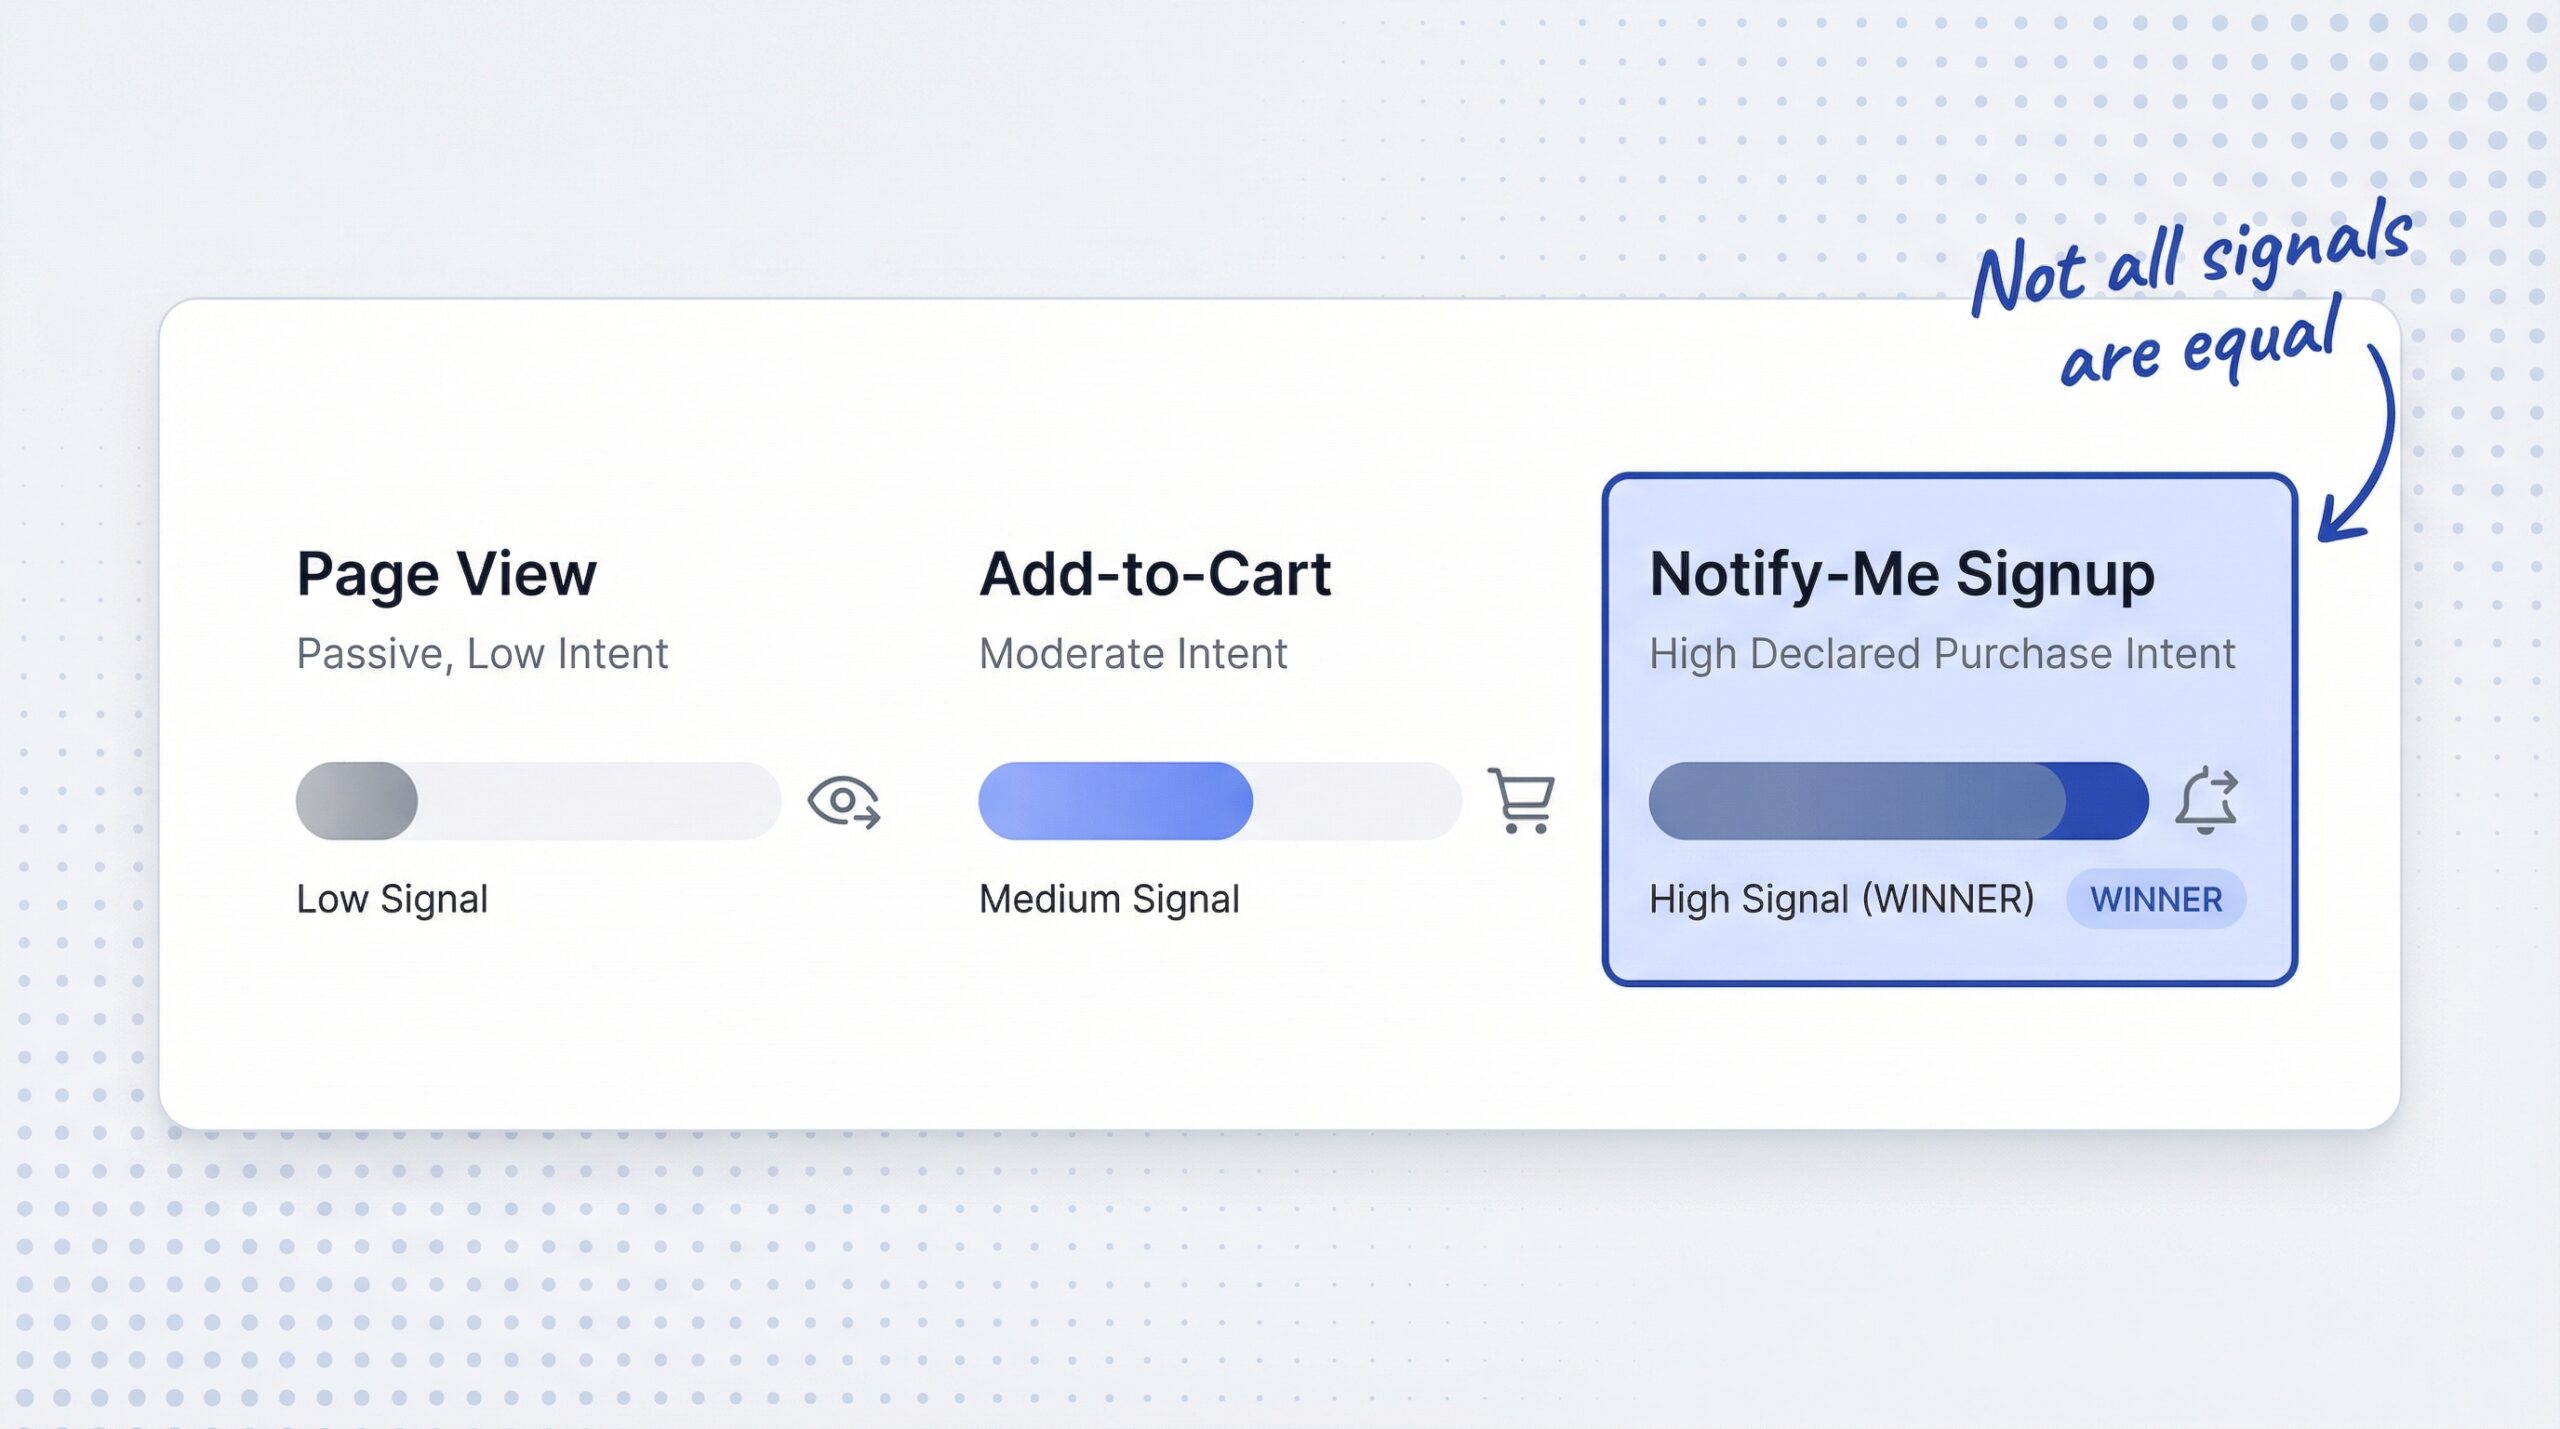
| Page view | None declared | No |
| Add to cart | Moderate (30-40% purchase rate) | Partially |
| Notify-me signup | High (declared purchase intent) | Yes, directly |
| Completed sale | Confirmed | Backward-looking only |
Add signup velocity as an implied daily demand input to the standard reorder point formula. One column. No new software required.
Standard Reorder Point (ROP):
ROP = (Average daily sales x supplier lead time in days) + safety stock
Enhanced ROP with signup data:
Enhanced ROP = ((Average daily sales + Implied daily demand) x lead time) + safety stock
Where Implied daily demand = (Weekly new signups x 0.22) / 7
The 0.22 multiplier represents the typical 20-25% conversion rate for notify-me subscribers based on back-in-stock conversion rate benchmarks for Shopify.
Worked example:
| Input | Value |
|---|---|
| Current stock | 80 units |
| Supplier lead time | 15 days |
| Average daily sales | 4 units |
| Safety stock | 15 units |
| Weekly notify-me signups (partial OOS variant) | 35 |
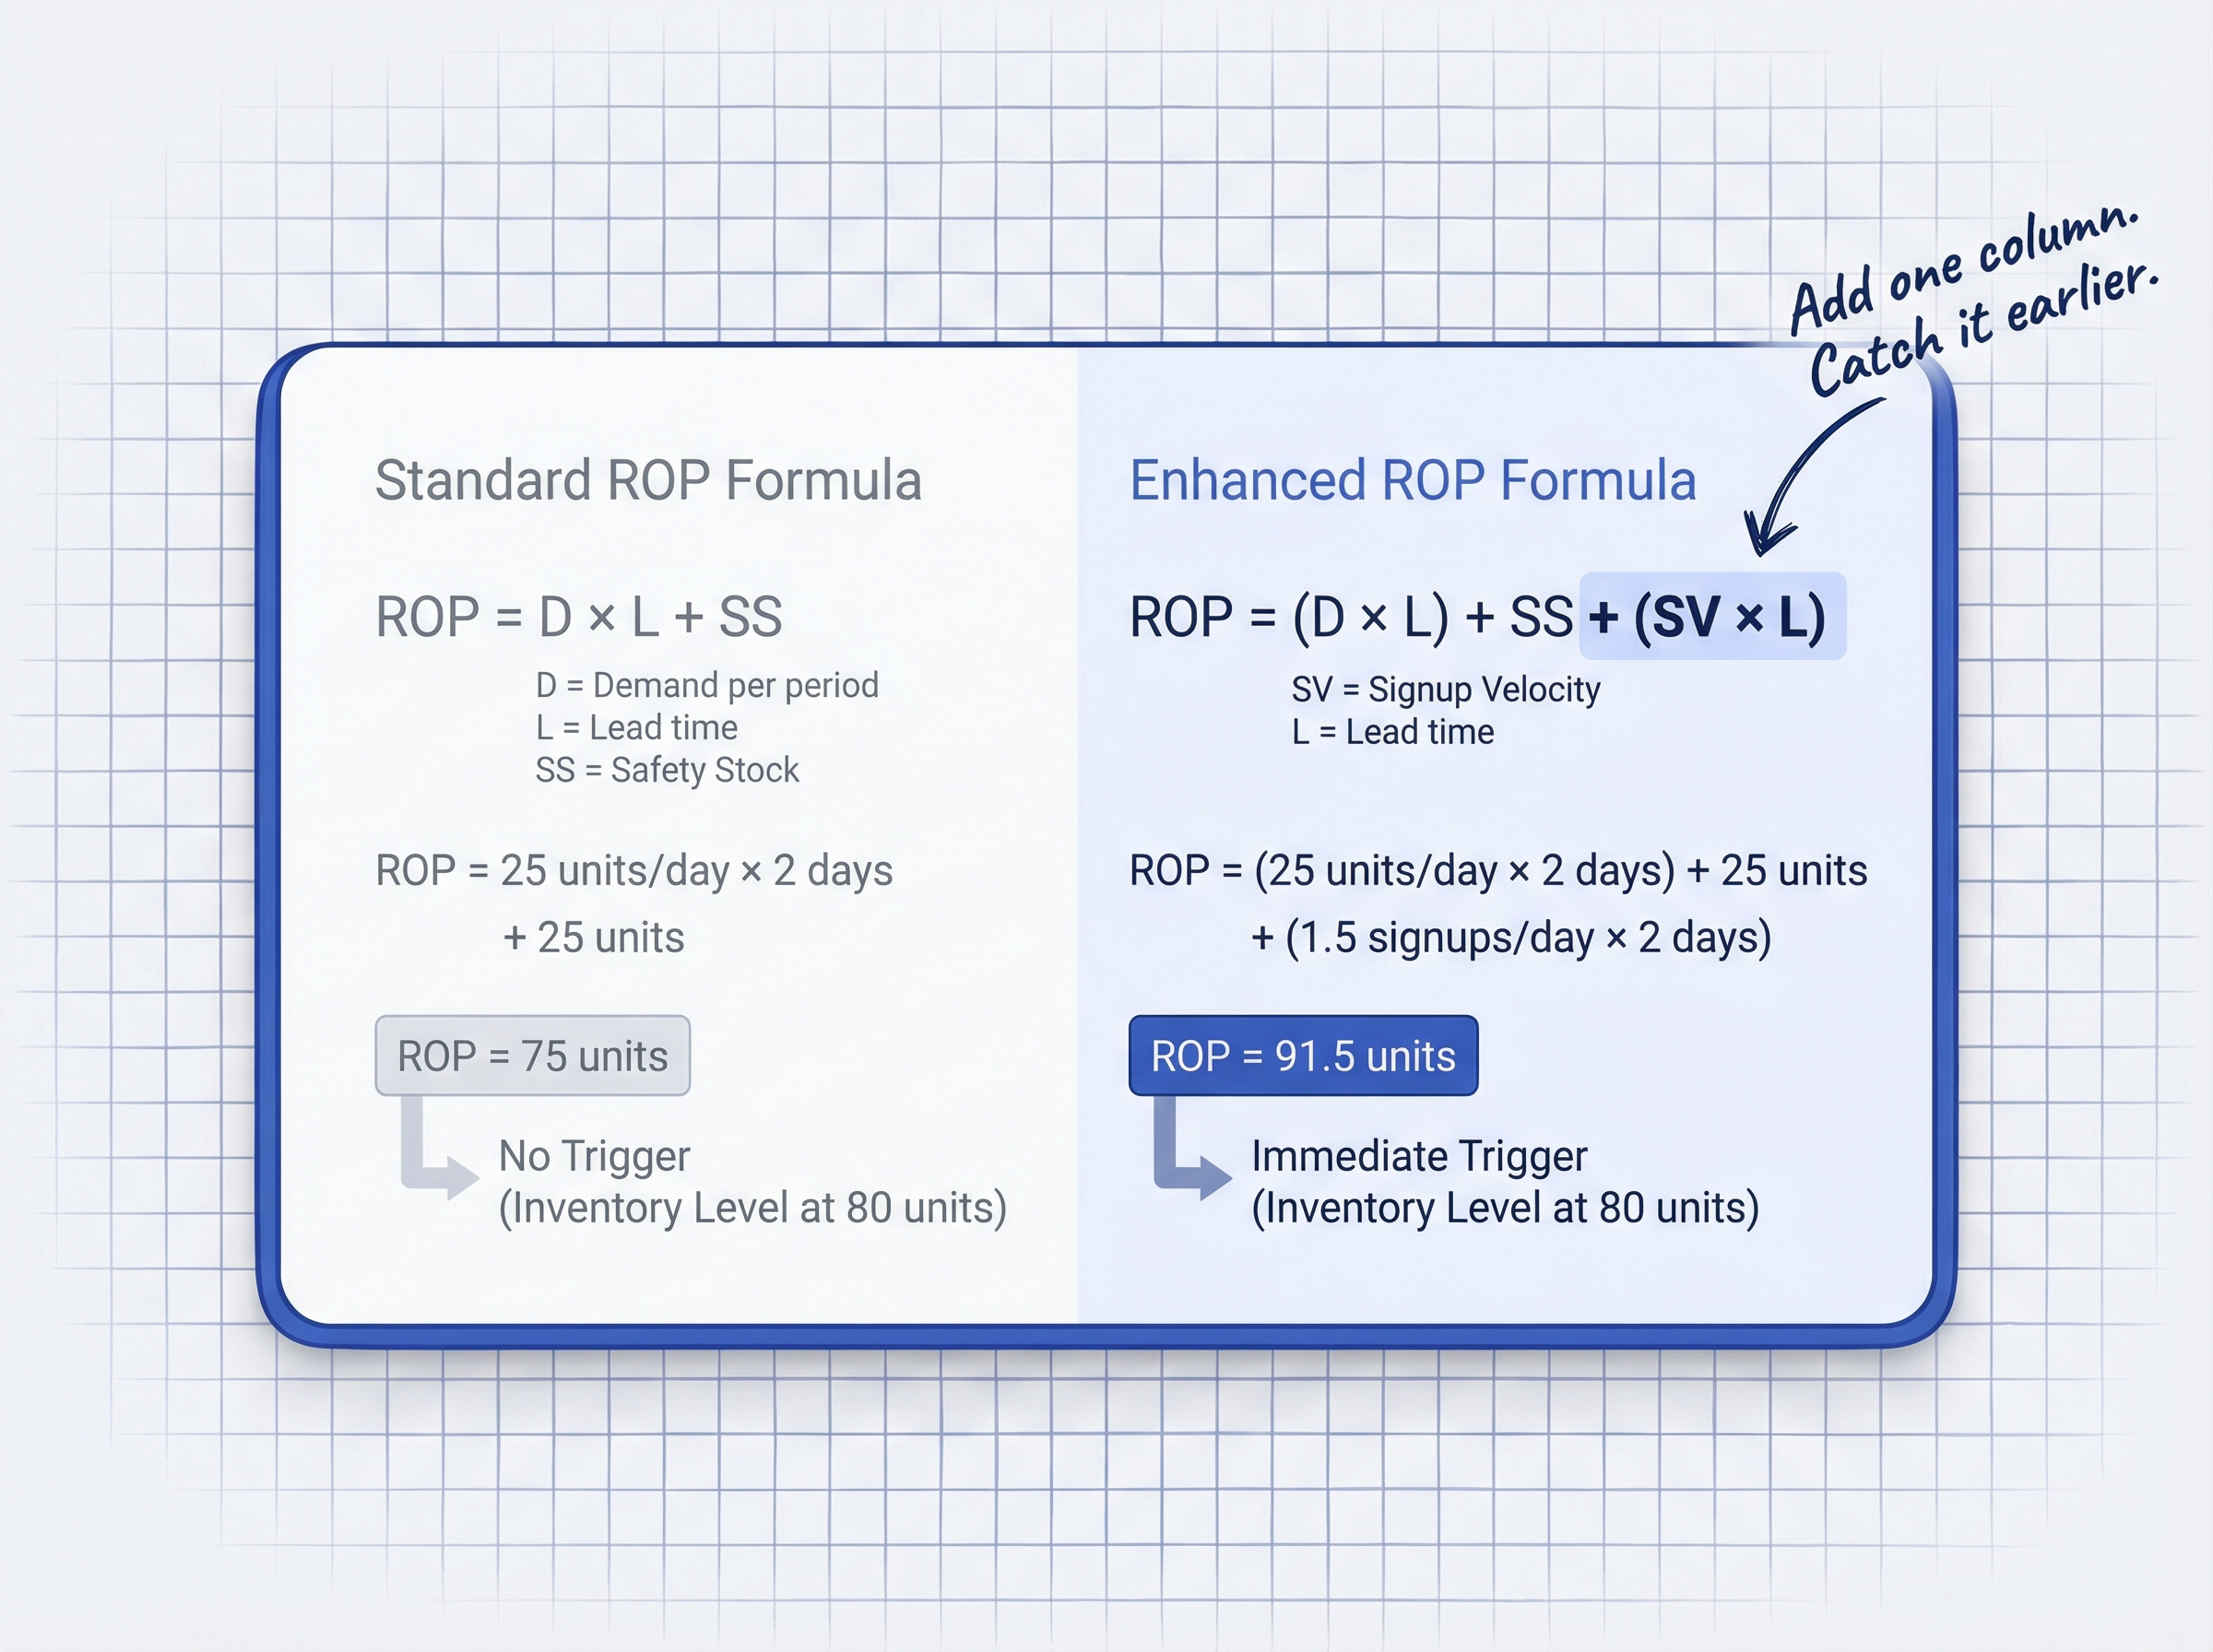
Standard ROP = (4 x 15) + 15 = 75 units. No reorder triggered. You still have 80 units.
Implied daily demand = (35 x 0.22) / 7 = 1.1 units/day
Enhanced ROP = ((4 + 1.1) x 15) + 15 = 91.5 units. Reorder triggered immediately. You have 80 units but need 91.5.
The signup data moved the reorder trigger forward by the exact margin needed to avoid a stockout. Without it, you would have placed the order too late.
Traditional demand forecasting methods show 30-40% error rates when facing promotional events and demand spikes (IJSAT, 2025). This enhanced ROP approach is not complex AI. It is adding one column to your existing reorder spreadsheet. It supplements whatever system you already use.
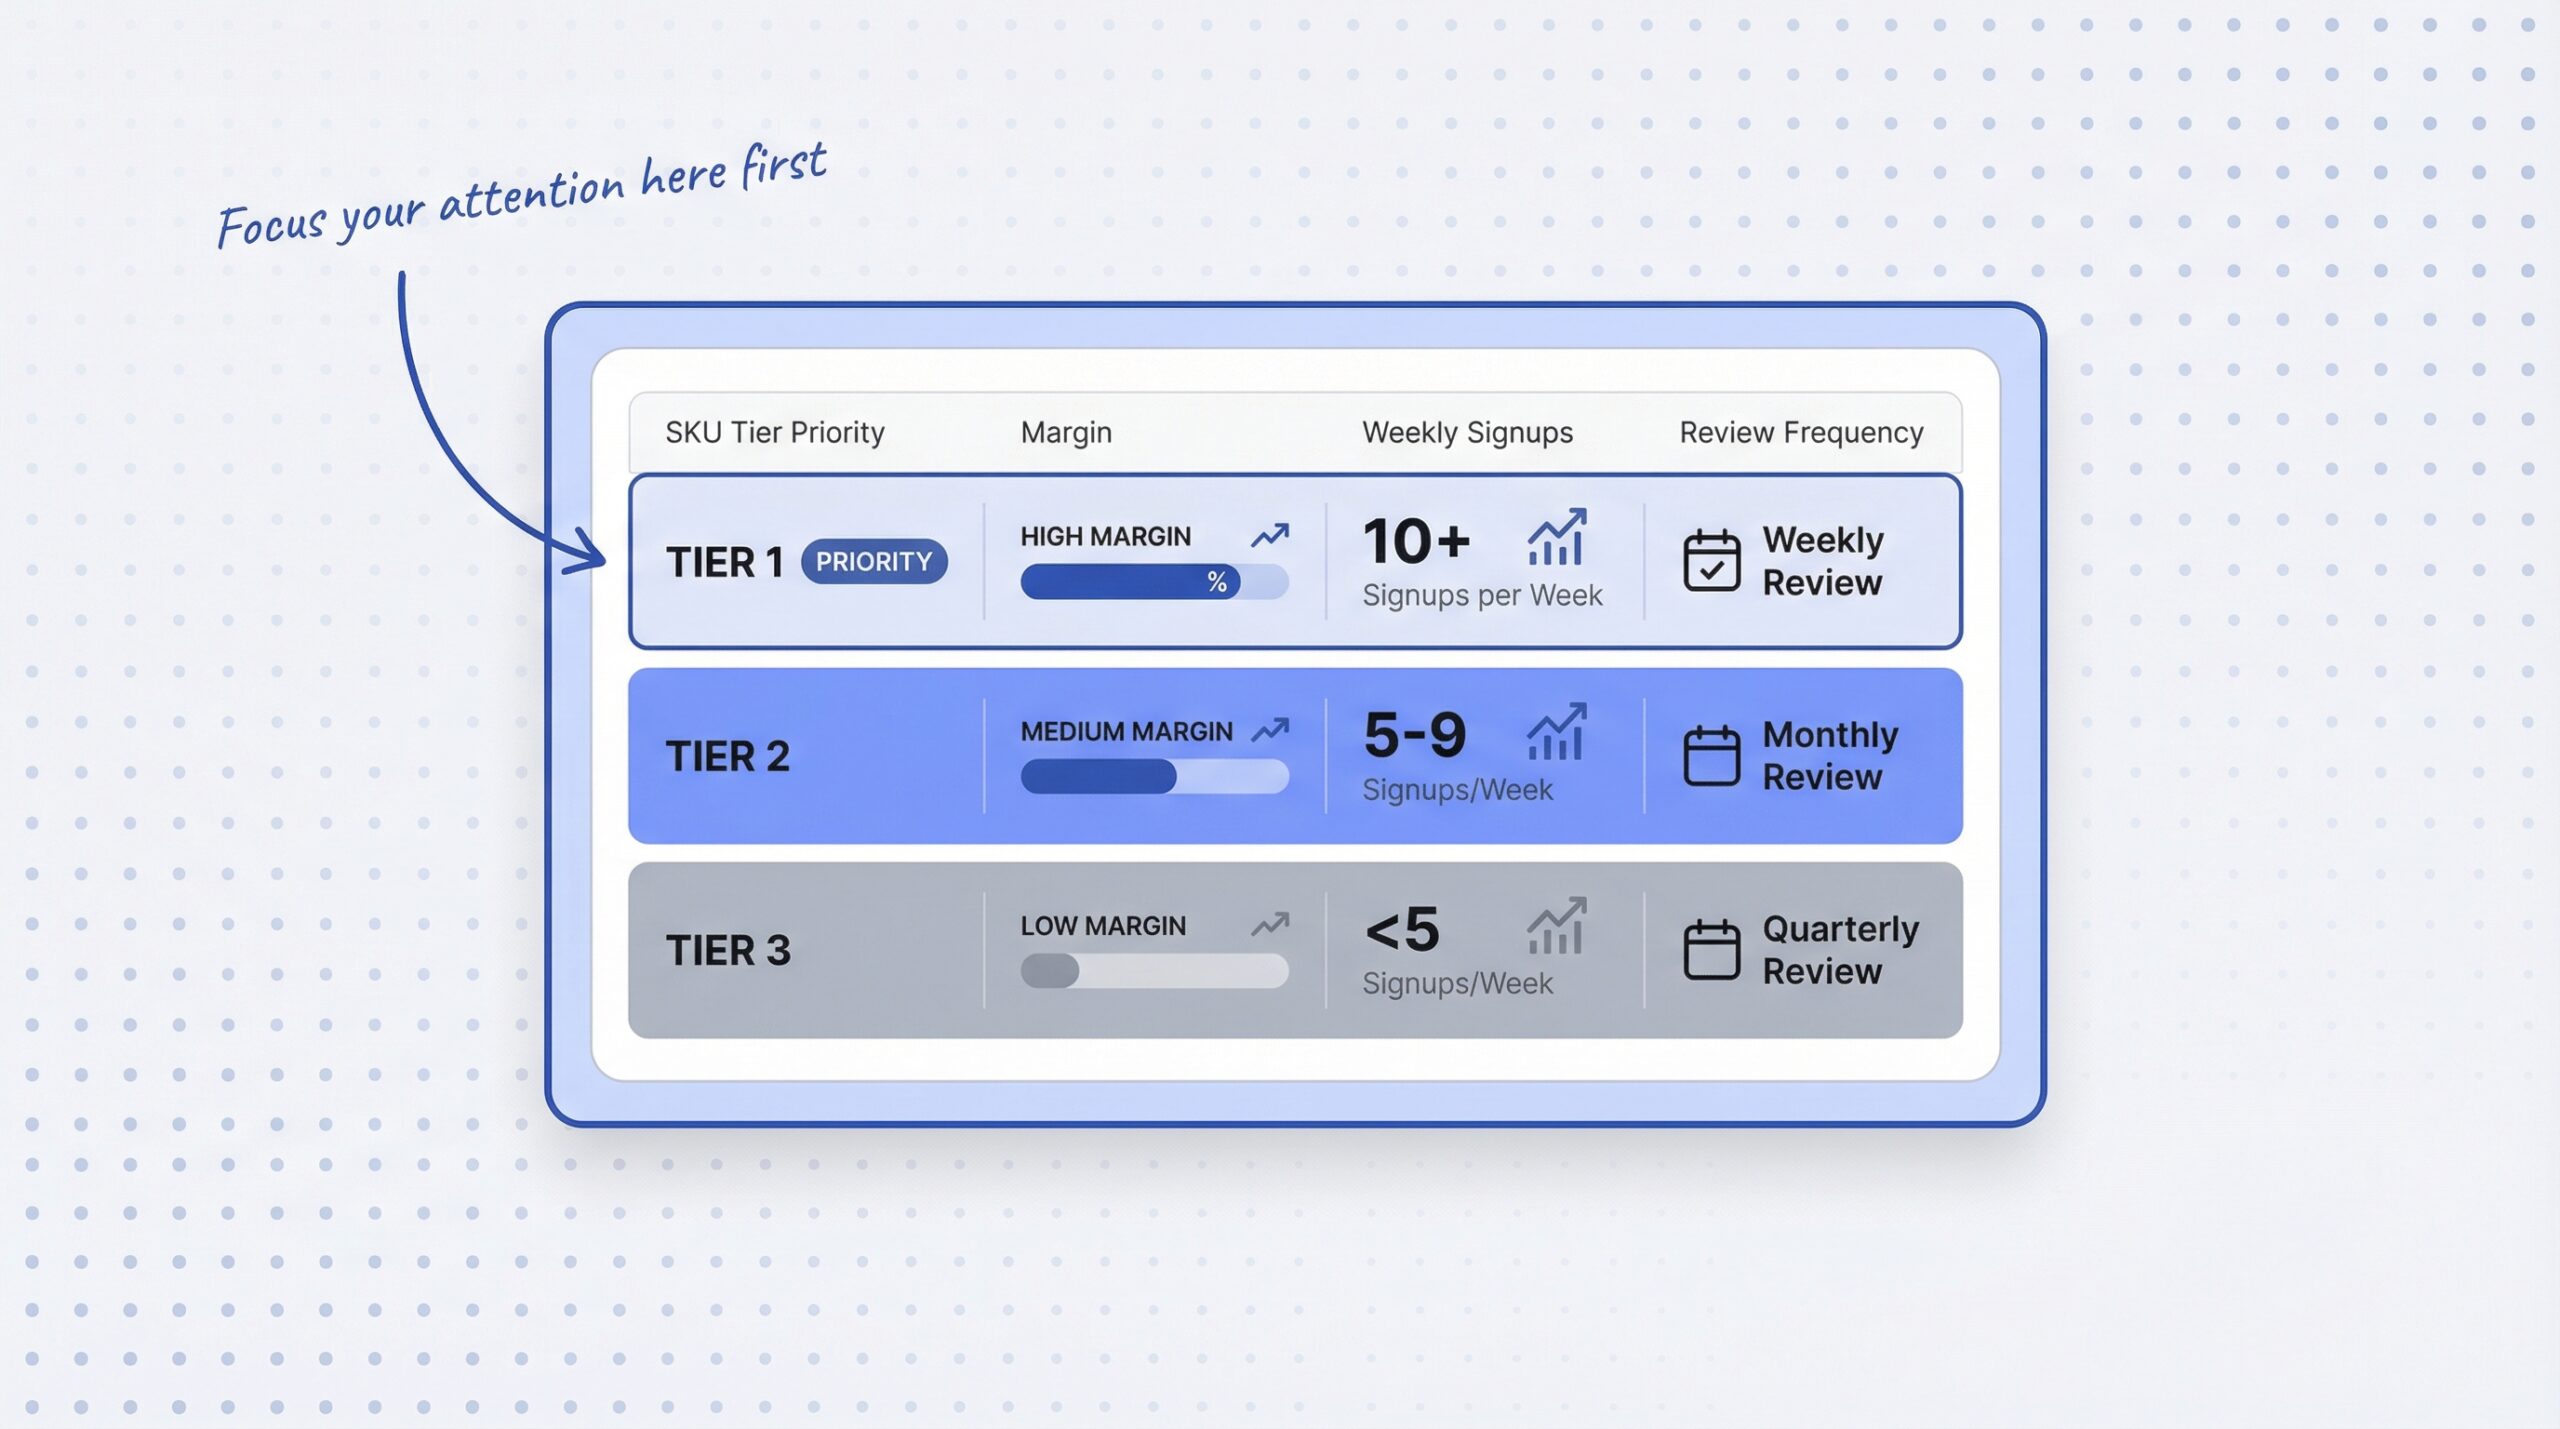
Not all SKUs deserve the same attention. Focus the enhanced ROP calculation on your highest-value products first.
| Tier | Criteria | Signup Velocity | Review Frequency | Action |
|---|---|---|---|---|
| Tier 1 | High-margin SKUs with active signups | 10+ signups/week | Weekly | Apply enhanced ROP formula |
| Tier 2 | Mid-margin, steady-moving SKUs | 1-9 signups/week | Bi-weekly | Track velocity trend only |
| Tier 3 | Low-margin, slow-moving products | 0 signups/week | Monthly | Standard ROP only |
The 80/20 principle applies: in most Shopify stores, roughly 20% of SKUs generate 80% of revenue. Tier 1 is almost entirely within that 20%.
Practical filter: export signup counts weekly from your notify-me app. Filter to products with remaining inventory. Sort by signups per week. Any product with 10 or more signups per week is an automatic Tier 1 watch.
Only 7% of companies achieve inventory forecast accuracy above 90% (Blue Ridge Global, 2024). You cannot make every SKU perfectly forecasted. But concentrating accuracy effort on your top-revenue products, the ones your customers are actively signing up for, gives you the highest return on that 10 minutes of attention.
Understanding what stockouts actually cost your Shopify store makes the case for why Tier 1 products deserve weekly monitoring.
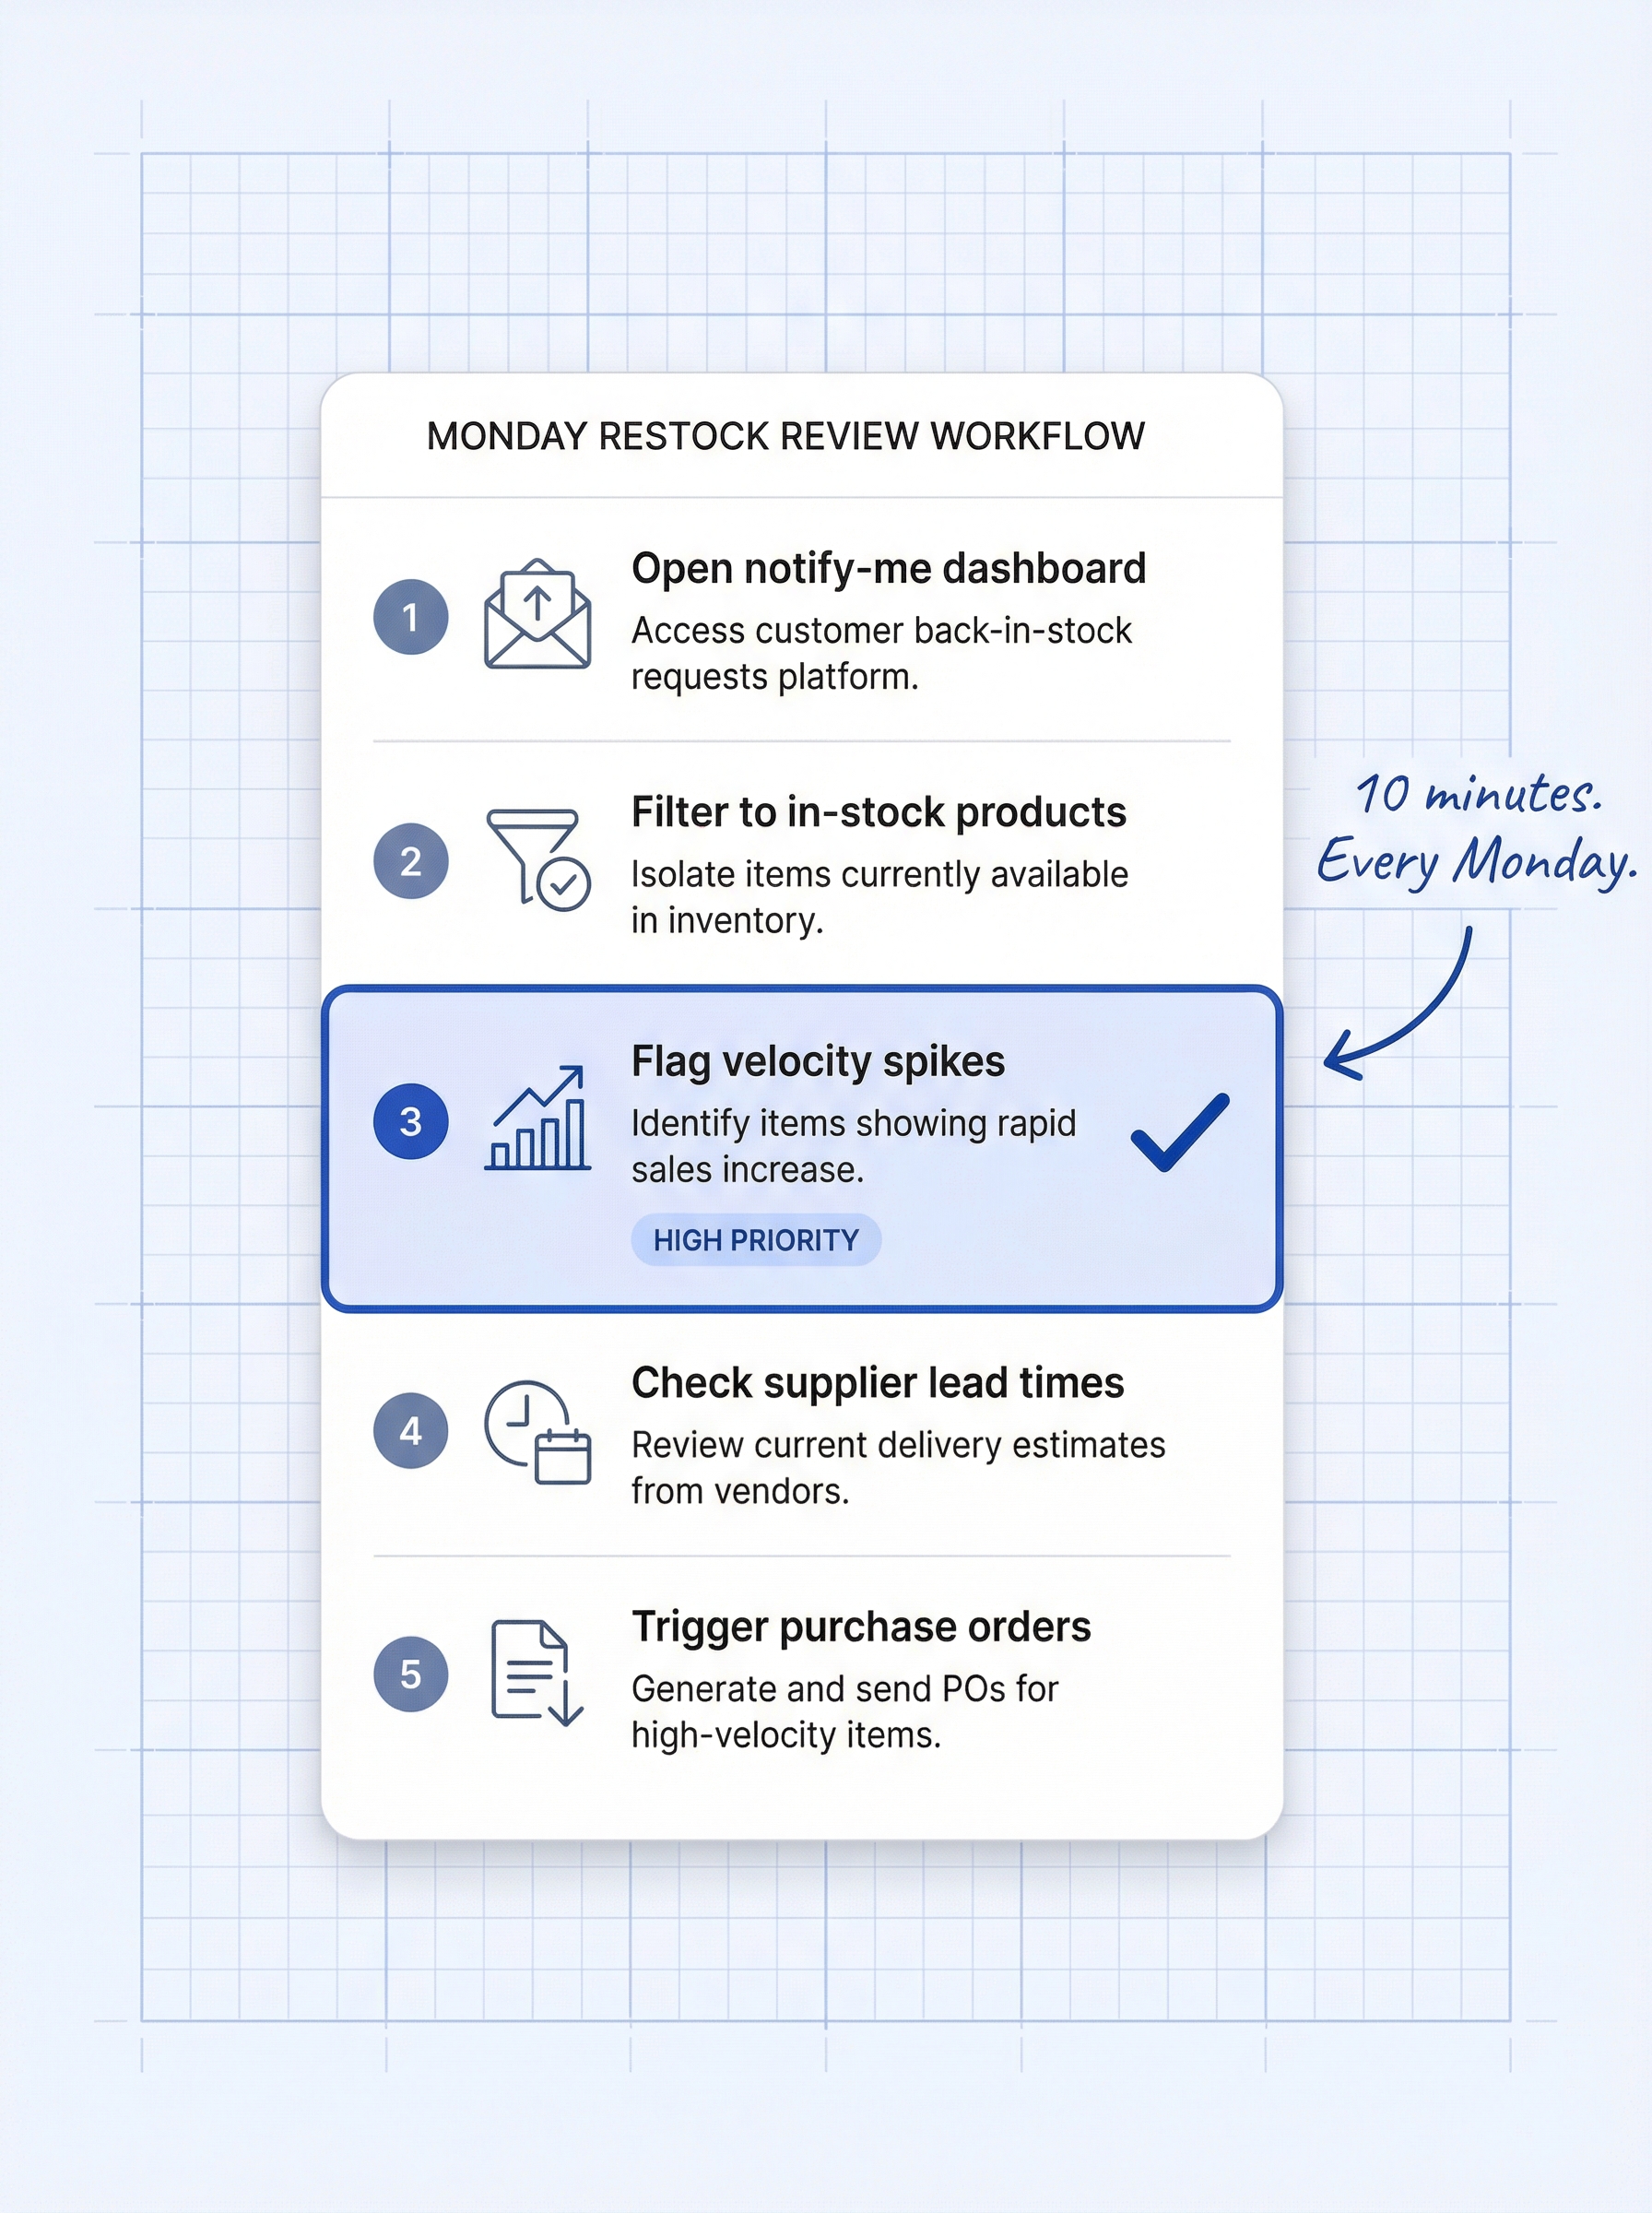
A 10-minute Monday morning review catches the majority of potential stockouts before they happen. The bottleneck is not time. It is building the habit.
The Monday Restock Review (5 steps):
StoreBeep’s waitlist analytics surface per-SKU signup counts and signup velocity trends, removing the need to manually export or count signups. If you have a “Notify Me” button on your Shopify product pages, you already have the data capture layer in place.
The downstream payoff is measurable. Back-in-stock emails achieve a 58% open rate and 6.46% conversion rate, the highest conversion rate of any email automation type in e-commerce (Omnisend’s 2025 ecommerce benchmarks, 2025). A stocked product sends those emails. An out-of-stock product sends none. Every week you catch a stockout early is a week of measurable back-in-stock alert ROI.
When customers experience repeated stockouts, 55% will not return to that store even after inventory is restored (Amra and Elma, 2024). Predictive restocking is not just about the sale you save today. It is about the customer you keep for next quarter.
Predictive restocking is the practice of using real-time demand signals, including notify-me signup velocity, to trigger a reorder before a stockout occurs rather than after. Unlike reactive restocking, which relies on sales history, predictive restocking reads forward-looking customer intent data. The notify-me signups accumulating on your product pages right now are a live demand signal you can act on today.
A practical starting threshold: if a product’s weekly signup rate represents more than 5% of your current stock level, treat it as a Tier 1 watch item. For example, if you have 200 units in stock and are collecting 12 signups per week, that 6% rate warrants applying the enhanced reorder point formula.
The enhanced ROP formula is: ((Average daily sales + Implied daily demand) x lead time in days) + safety stock. Implied daily demand is calculated as (weekly new signups x 0.22) / 7, where 0.22 represents the typical 20-25% conversion rate for notify-me subscribers.
Record your total signup count weekly in a spreadsheet and calculate the week-over-week change yourself. That delta is your velocity signal. Most notify-me apps include signup timestamps, which allows you to filter to the past 7 days for a manual weekly total.
Yes, with one adjustment: weight recent signup velocity more heavily than historical sales data for seasonal SKUs. If a summer product starts collecting signups in April, that intent data is a stronger signal than last summer’s sales history.
Shopify’s native forecasting uses sales history and trend data but does not ingest notify-me signup signals. The enhanced ROP approach is a manual supplement to Shopify’s native tools, not a replacement. You are adding a first-party demand signal that Shopify’s forecasting engine cannot see.
Especially yes. Fast sell-through confirms strong demand and makes signup velocity even more predictive. Predictive restocking means you have a larger quantity ready when the sell-through event arrives, capturing more revenue per restock cycle before running out again.
No. Signup velocity is one additional input to supplement your existing system, whether that is a spreadsheet, a Shopify app, or a dedicated forecasting tool. Merchants who currently have no forecasting system at all can start with this approach as a low-cost entry point.
Keep reading