March 12, 2026 · Gaurav Radadiya
You have heard the stat before. Back-in-stock emails convert at 6.46%. But what does that number actually mean for your store? Is 6% good? Is your 4% a problem or a starting point?
The trouble with back-in-stock notification benchmarks 2026 data is that most articles cite one or two numbers from one source and call it a day. Nobody has compiled the full picture across email, SMS, and WhatsApp with data you can actually benchmark against.
This article fixes that. We pulled back-in-stock notification benchmarks for 2026 from Omnisend’s analysis of 150,000+ brands, Klaviyo’s industry reports, and channel-specific studies to give you a single reference for every metric that matters. Open rates, click rates, conversion rates, revenue per send, and opt-out rates, broken down by channel and store size.
Bookmark this page. You will come back to it.
Before diving into the benchmarks, some context on why these numbers matter.
Automated emails generated 41% of all email-driven revenue while representing just 5.3% of total sends, according to Omnisend’s email marketing benchmarks for 2026. That is a staggering efficiency gap. But within the automation category, back-in-stock alerts sit at the very top.
The reason is intent. Someone who clicked “Notify Me” on a sold-out product has already decided they want it. They are not browsing. They are not comparison shopping. They are waiting for you to tell them the product is available so they can buy it.
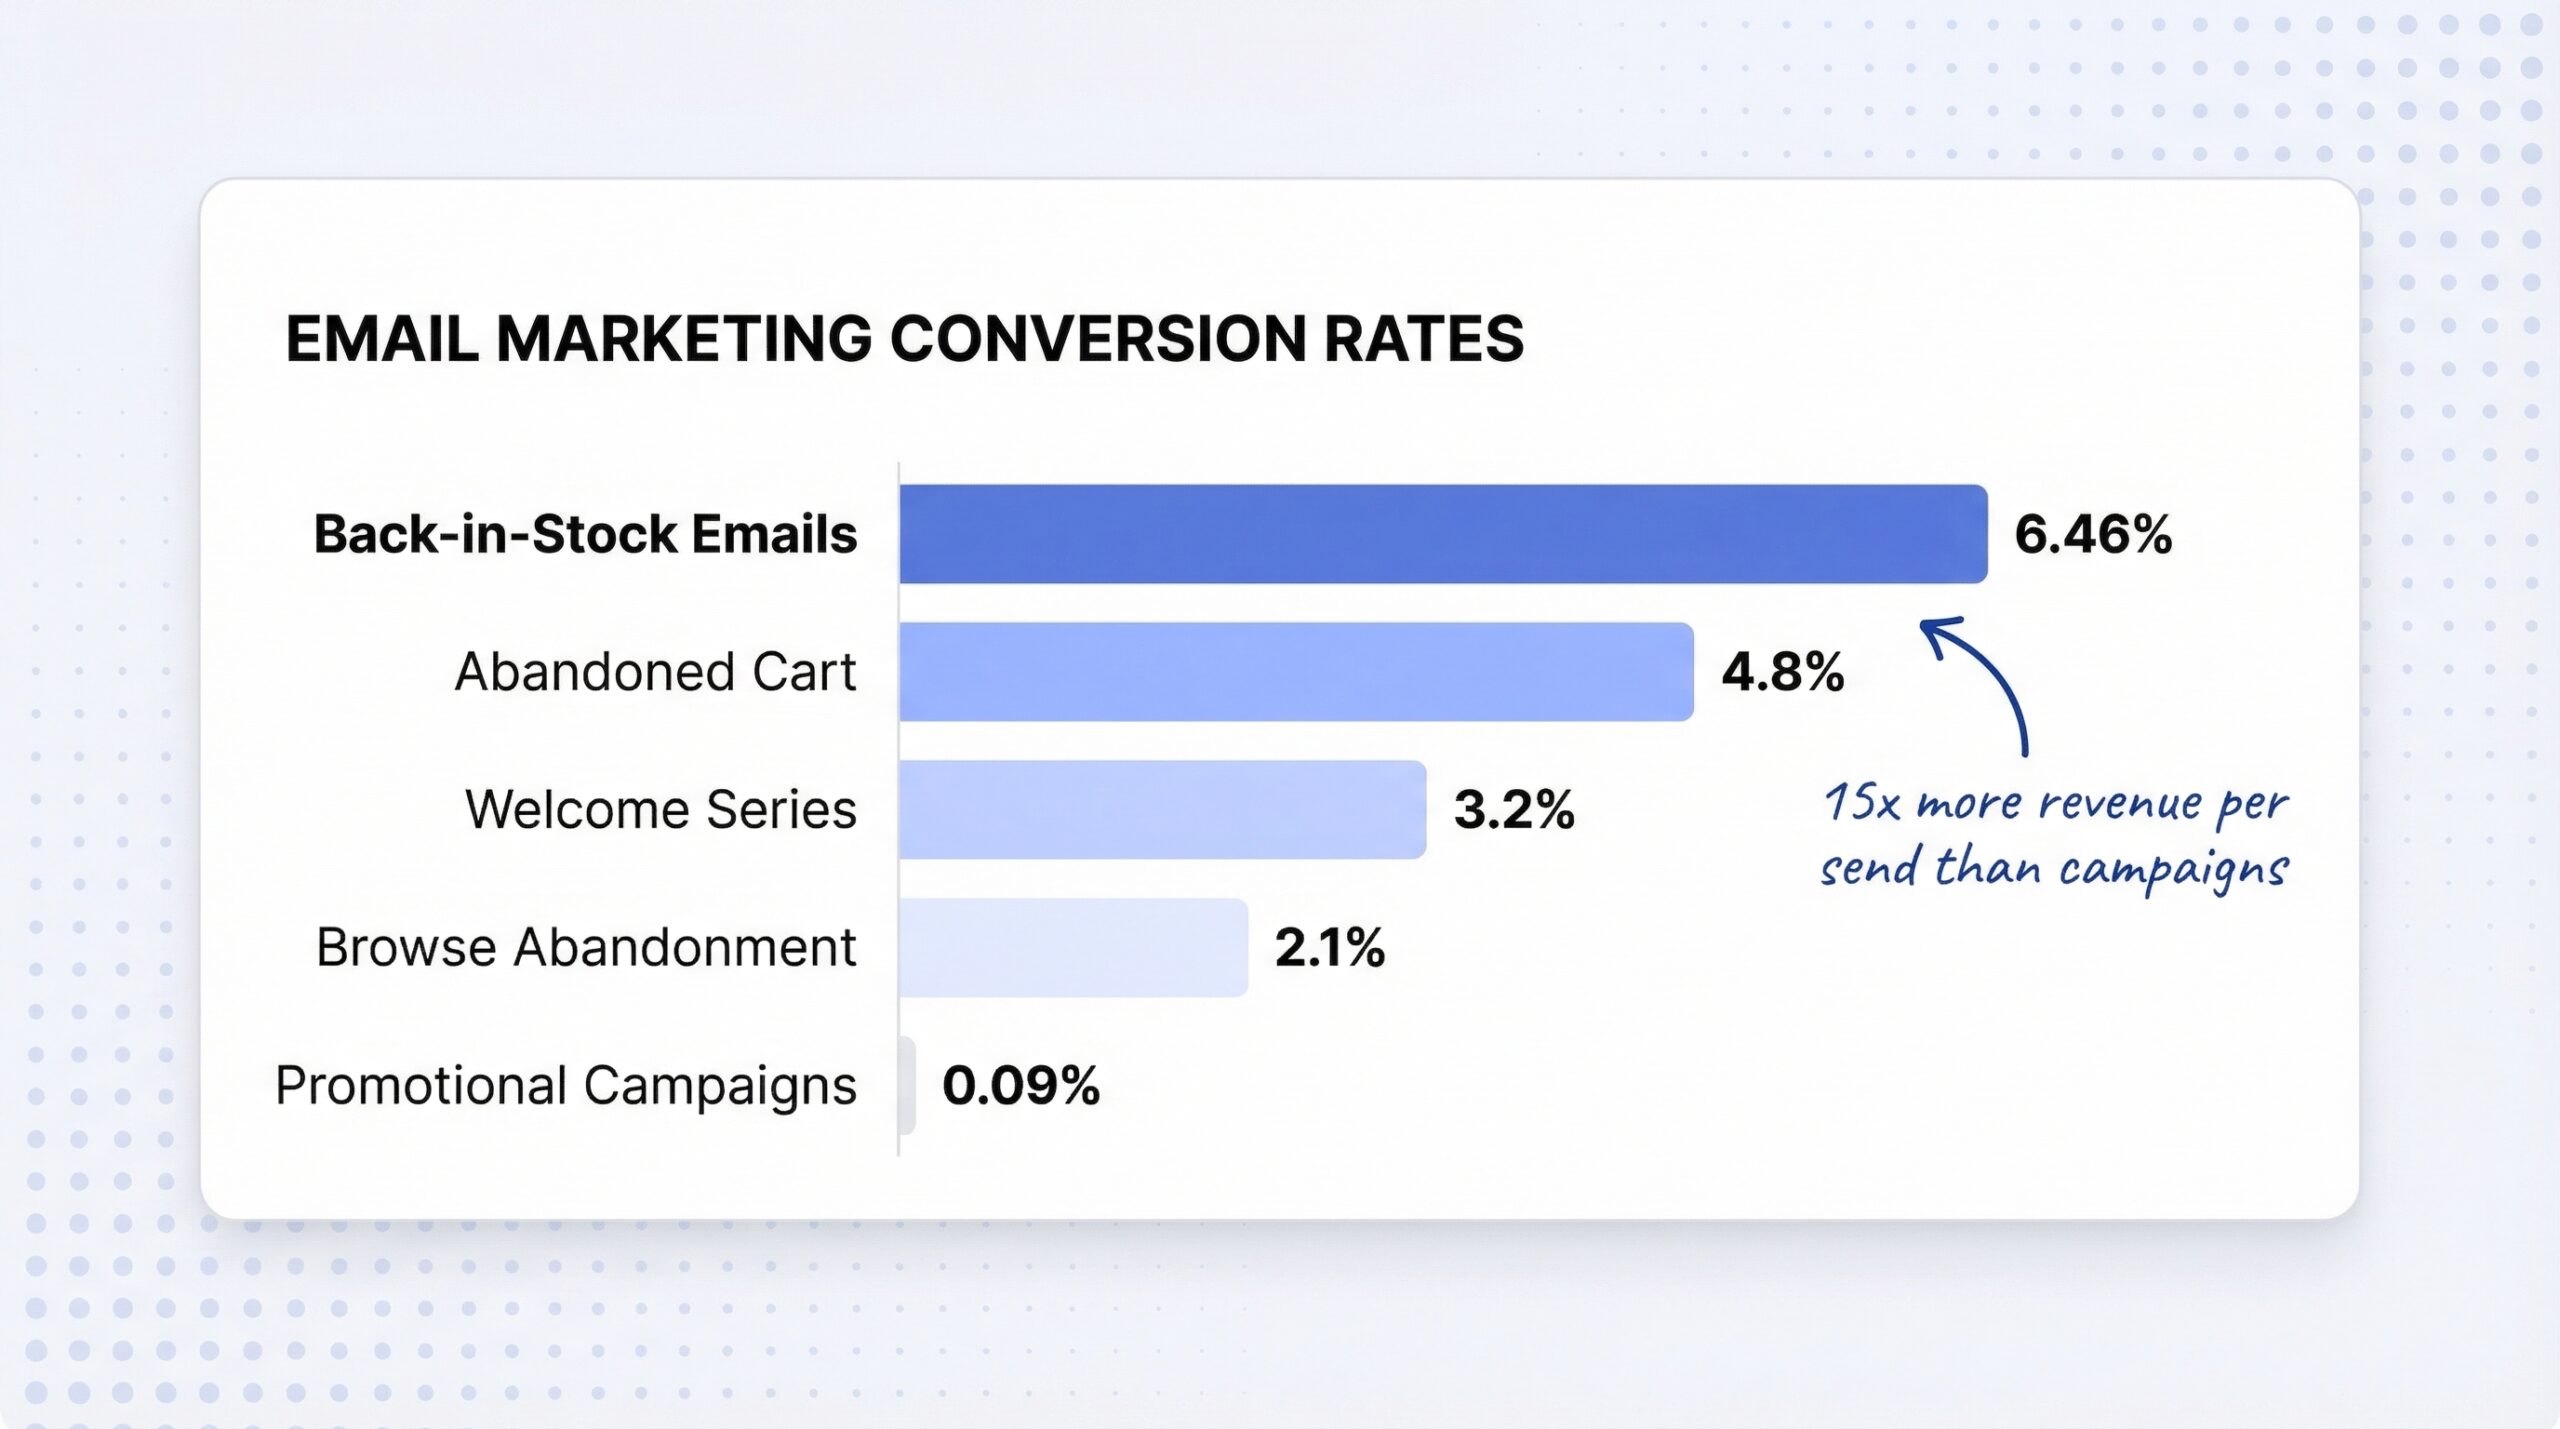
That built-in purchase intent is why back-in-stock emails convert at 6.46% while the average promotional email converts at 0.09%. It is also why what stockouts actually cost your Shopify store goes far beyond the immediate lost sale. Every subscriber you fail to notify is a customer you have already lost once and are about to lose again.
Automated flows earned $2.87 per email sent compared to $0.18 for campaign emails, making them 15x more efficient on a per-send basis. Back-in-stock sits at the premium end of that automated range because subscribers are, by definition, ready to buy.
Email remains the most data-rich channel for restock alert performance data. Here is what the numbers show across multiple sources.
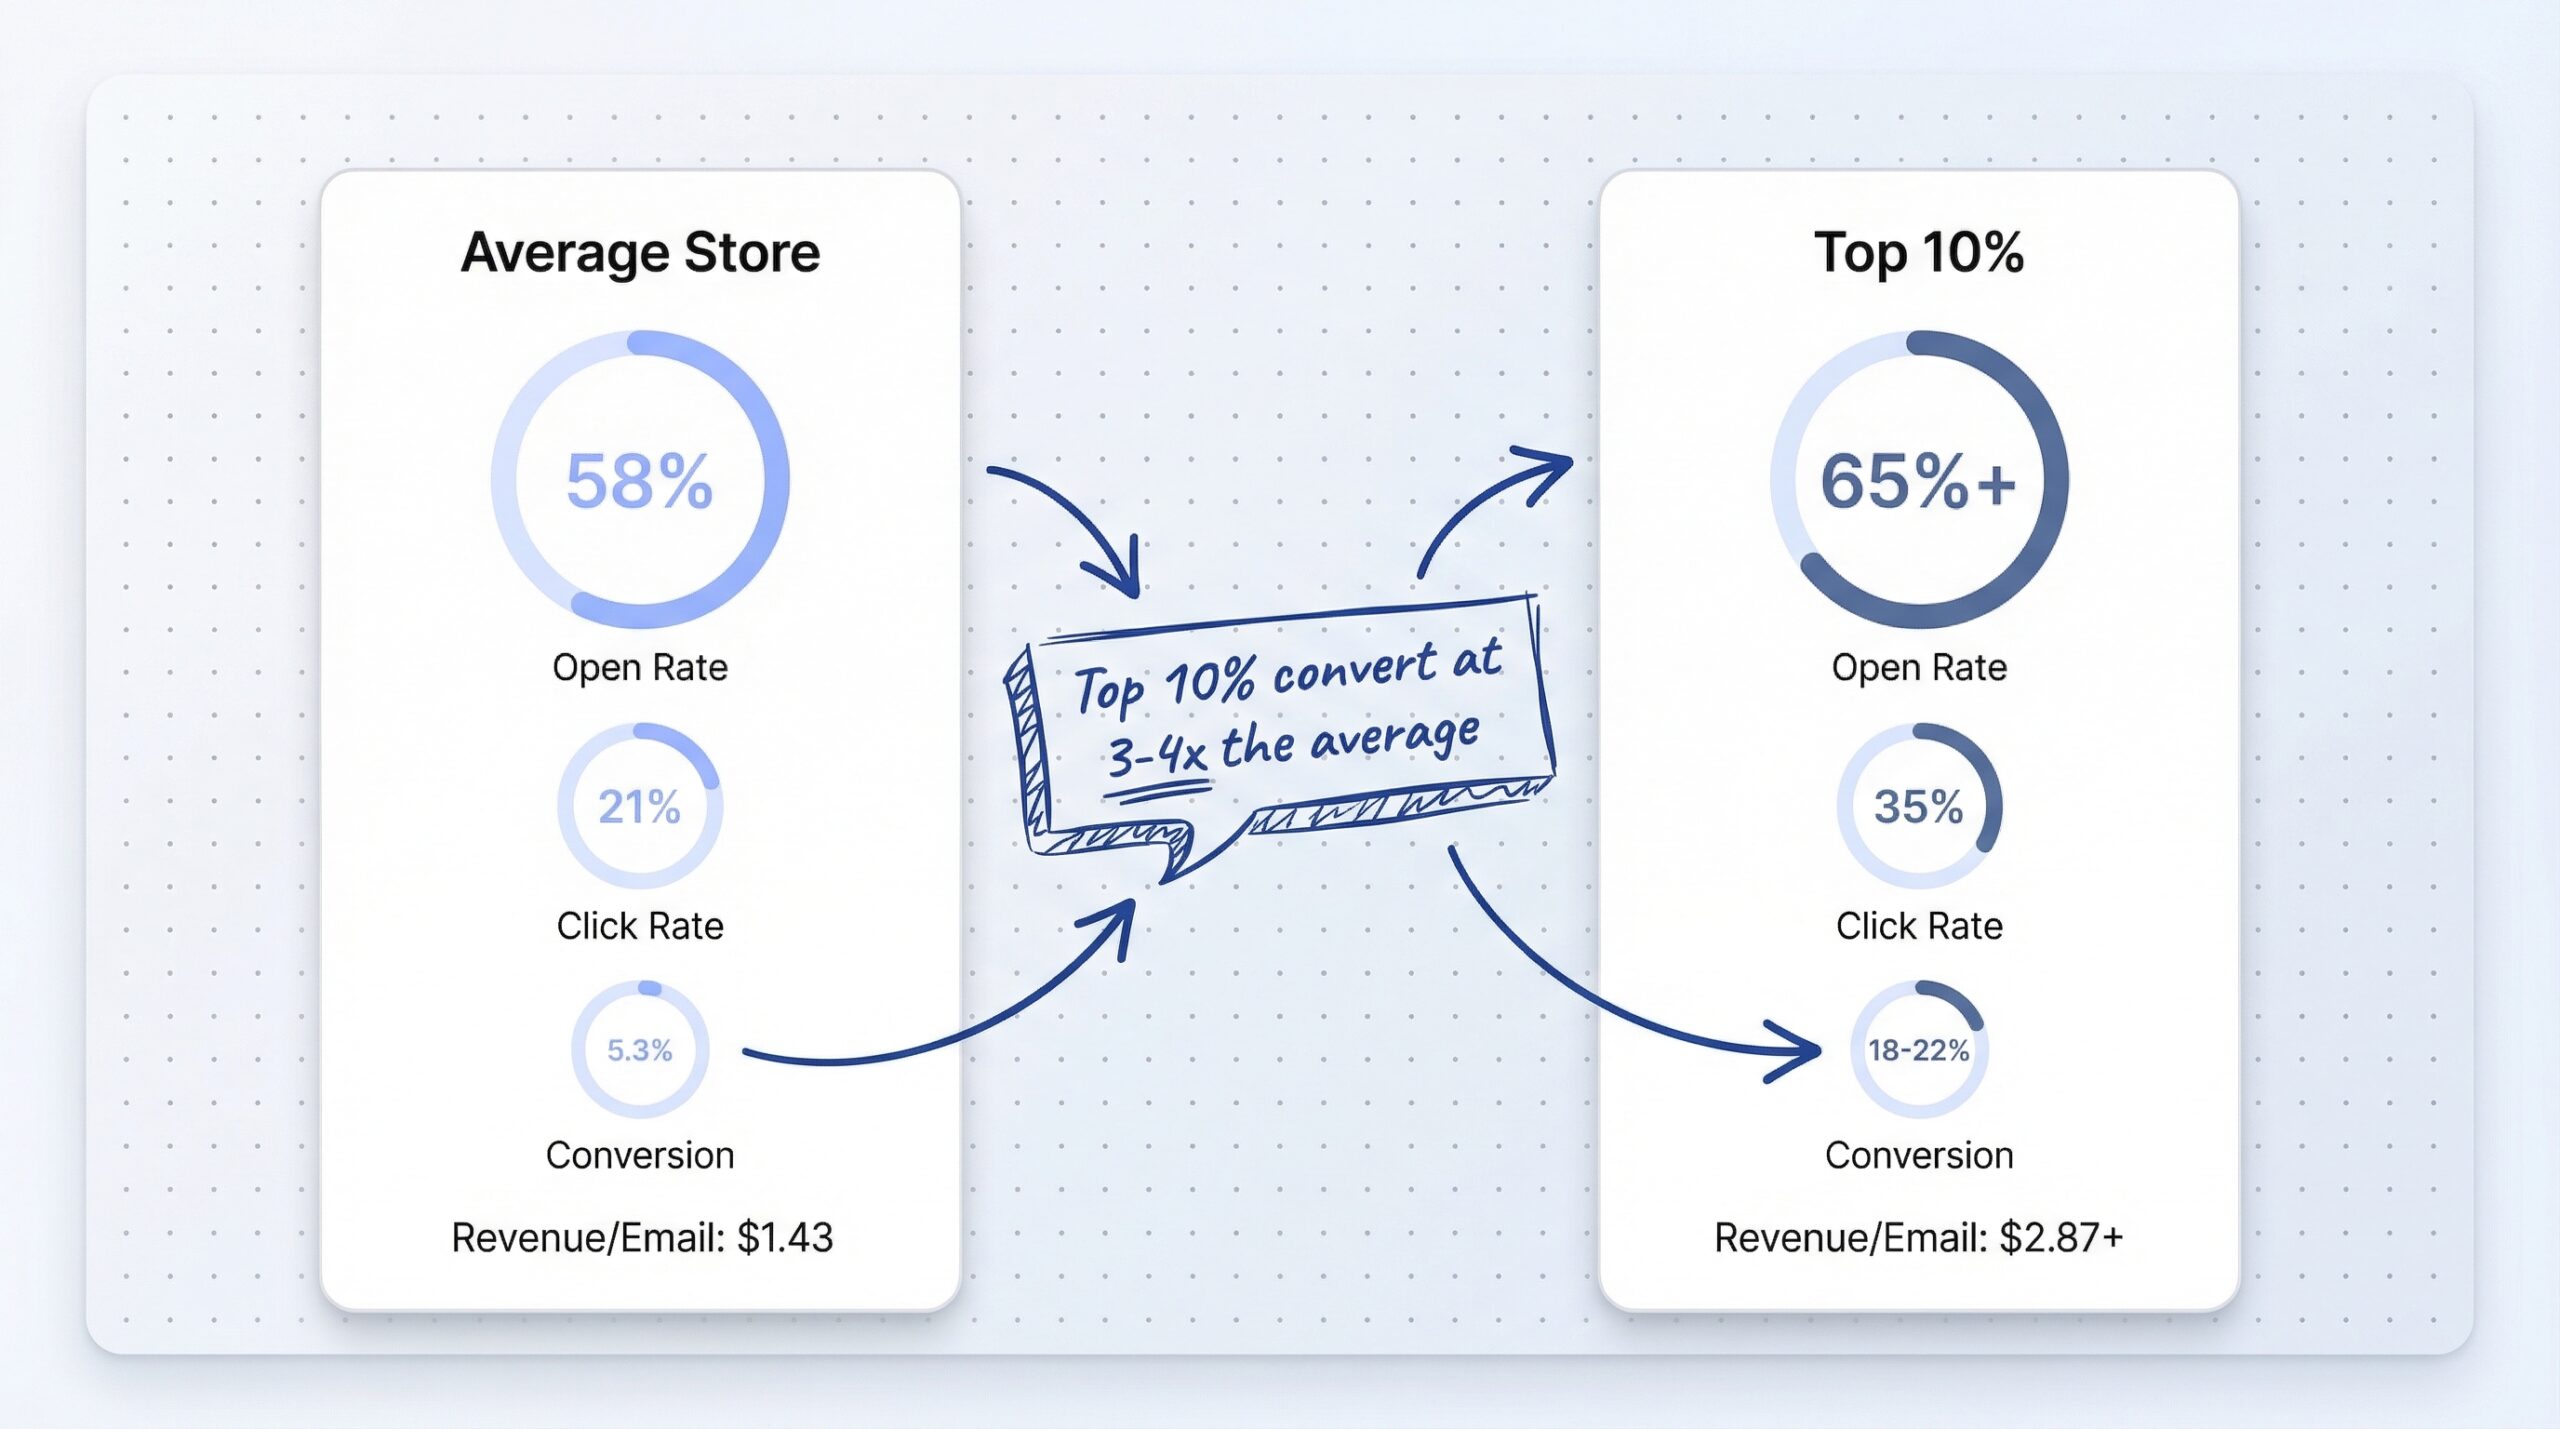
Back-in-stock emails achieve 58-65% open rates depending on the data source. Omnisend reports 58.03% across their merchant base, while Barilliance data puts the figure at 65.32%. The back-in-stock email open rate benchmark sits well above any other automated email category.
For context, the average promotional email open rate sits around 26%. Back-in-stock emails more than double that because subscribers opted in for a specific product update.
The industry average click rate for back-in-stock emails is 21.19% (Omnisend). Top-performing stores achieve 30-35% click rates. One back-in-stock notification app reports consistent 30-35% CTR across their merchant base.
The click-to-conversion rate tells an even more compelling story. Of the people who click a back-in-stock email, 30.5% go on to purchase. That means roughly one in three clickers converts.
Here is where the benchmarks get interesting. If you are searching for a restock notification conversion rate 2026 baseline, start here. The “industry average” depends heavily on who is measuring.
| Performance Tier | Conversion Rate | Revenue Per Email | What It Means |
|---|---|---|---|
| Average store | 5.34-6.46% | $1.43 | Solid baseline, room to grow |
| Above average (top 25%) | 12-15% | $2.00+ | Good restock email subject lines and timing |
| Top performer (top 10%) | 18-22% | $2.87+ | Optimized everything, from signup to send |
| Documented best case | 22.45% | Not reported | MarketingSherpa case study of a single retailer |
The gap between average and top performers is enormous. A store converting at 5% is leaving 3-4x revenue on the table compared to what is achievable with better back-in-stock email designs.
SMS is the speed channel. It reaches customers within minutes and gets read almost immediately. But the performance profile is different from email.
SMS delivery rates benchmark at 95%+ for well-maintained lists, with top performers hitting 98-99%. The open rate sits at roughly 95%, though “open rate” for SMS is somewhat misleading since most phones display the message automatically.
The real engagement metric for SMS is click-through rate. Industry data for back-in-stock SMS messages shows an average CTR of 10.9-13.2%, which is lower than email’s 21% but arrives much faster.
SMS conversion rates for restock alerts show a wide range depending on implementation quality.
| Performance Tier | SMS CTR | SMS Conversion | Context |
|---|---|---|---|
| Industry average | 10.9-13.2% | 12-21% | Broad range from general SMS campaigns |
| Well-optimized restock | 16%+ | 24-37% | Stores with strong CTA and timing |
| Best documented case | 70.23% CTR | 36.83% | Lokai’s restock campaign (Voyage SMS) |
The Lokai case study is an outlier, but it shows what is possible when a brand with strong loyalty combines SMS with a high-demand restock event. The Klaviyo industry benchmark report for 2026 puts top 10% apparel brands at 16.65% SMS click rate, which is a more realistic target for most stores.
SMS opt-out benchmarks sit at 0.2-0.5% per campaign for well-targeted messages. Anything above 1% per send is a warning sign that your messaging frequency or relevance needs adjustment. Back-in-stock alerts tend to see lower opt-out rates than promotional SMS because the subscriber asked for the notification.
WhatsApp is the newest channel for restock notifications, and the benchmarks reflect that. Data is less standardized than email, and there is a significant gap between commonly reported numbers and verified data.
You will see claims of 95-98% open rates for WhatsApp. Those numbers come from self-reported surveys and are likely inflated. Braze’s enterprise data, which measures actual verified read receipts, puts the average at 60-68%.
That is still significantly higher than email’s 58-65%, but the difference is not as dramatic as marketing materials suggest. The honest benchmark: expect 60-68% verified read rates, with the possibility of higher numbers for highly engaged subscriber lists.
| Metric | Average | Top Performers | Source |
|---|---|---|---|
| Delivery Rate | 95-99% | 99%+ | AiSensy |
| Verified Read Rate | 60-68% | 80%+ | Braze |
| Click-Through Rate | 20-45% | 45-60% | Multiple sources |
| Conversion Rate | 5-15% | 15%+ | YaVendio |
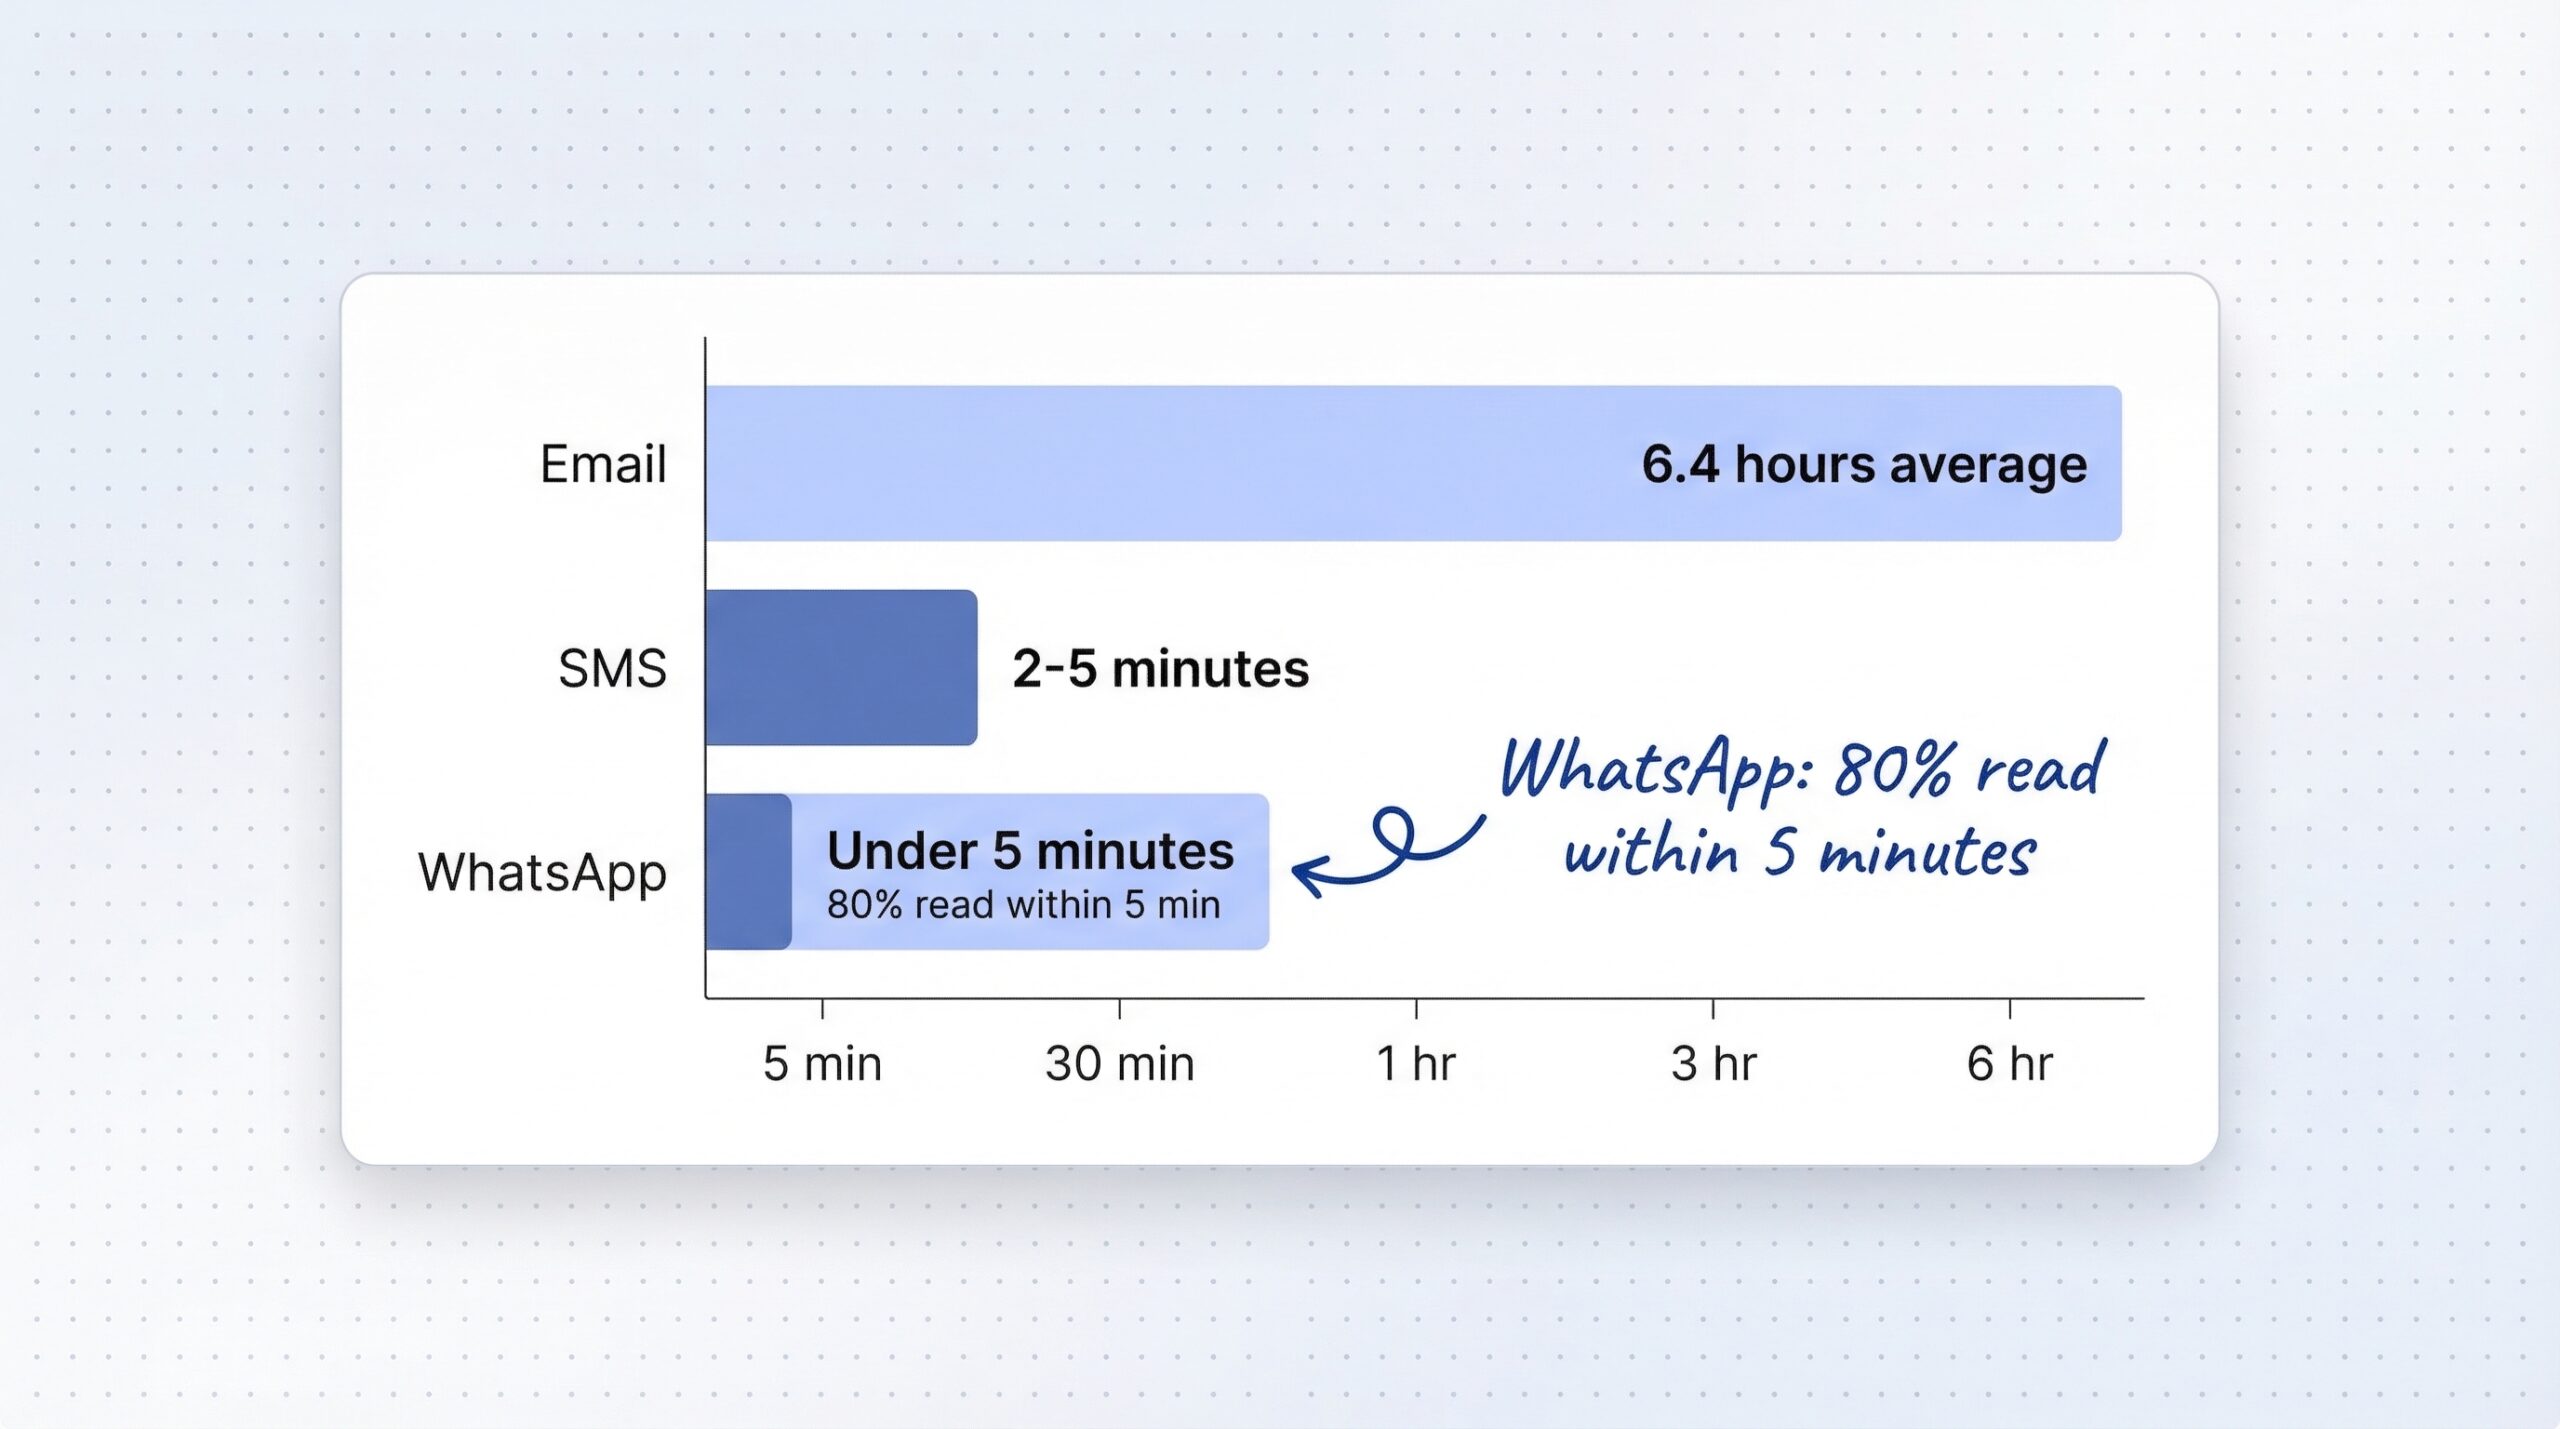
| Time to Open | 80% within 5 min | 95% within 3 min | YCloud |
WhatsApp’s standout metric is speed. The vast majority of messages are read within five minutes, making it the fastest channel for reaching customers after a restock event. If you are looking at WhatsApp back in stock alerts on Shopify, the speed advantage is the primary selling point.
This is the table that does not exist anywhere else. Here is every channel compared on every metric that matters for back-in-stock notification benchmarks 2026.
| Metric | SMS | ||
|---|---|---|---|
| Delivery Rate | 95-99% | 95-98% | 95-99% |
| Open/Read Rate | 58-65% | ~95% | 60-68% (verified) |
| Click Rate | 21-35% | 10.9-16% | 20-60% |
| Conversion Rate | 5.3-22% | 12-37% | 5-15% |
| Revenue Per Send | $1.43 avg | $0.80-0.85 RPR | Limited data |
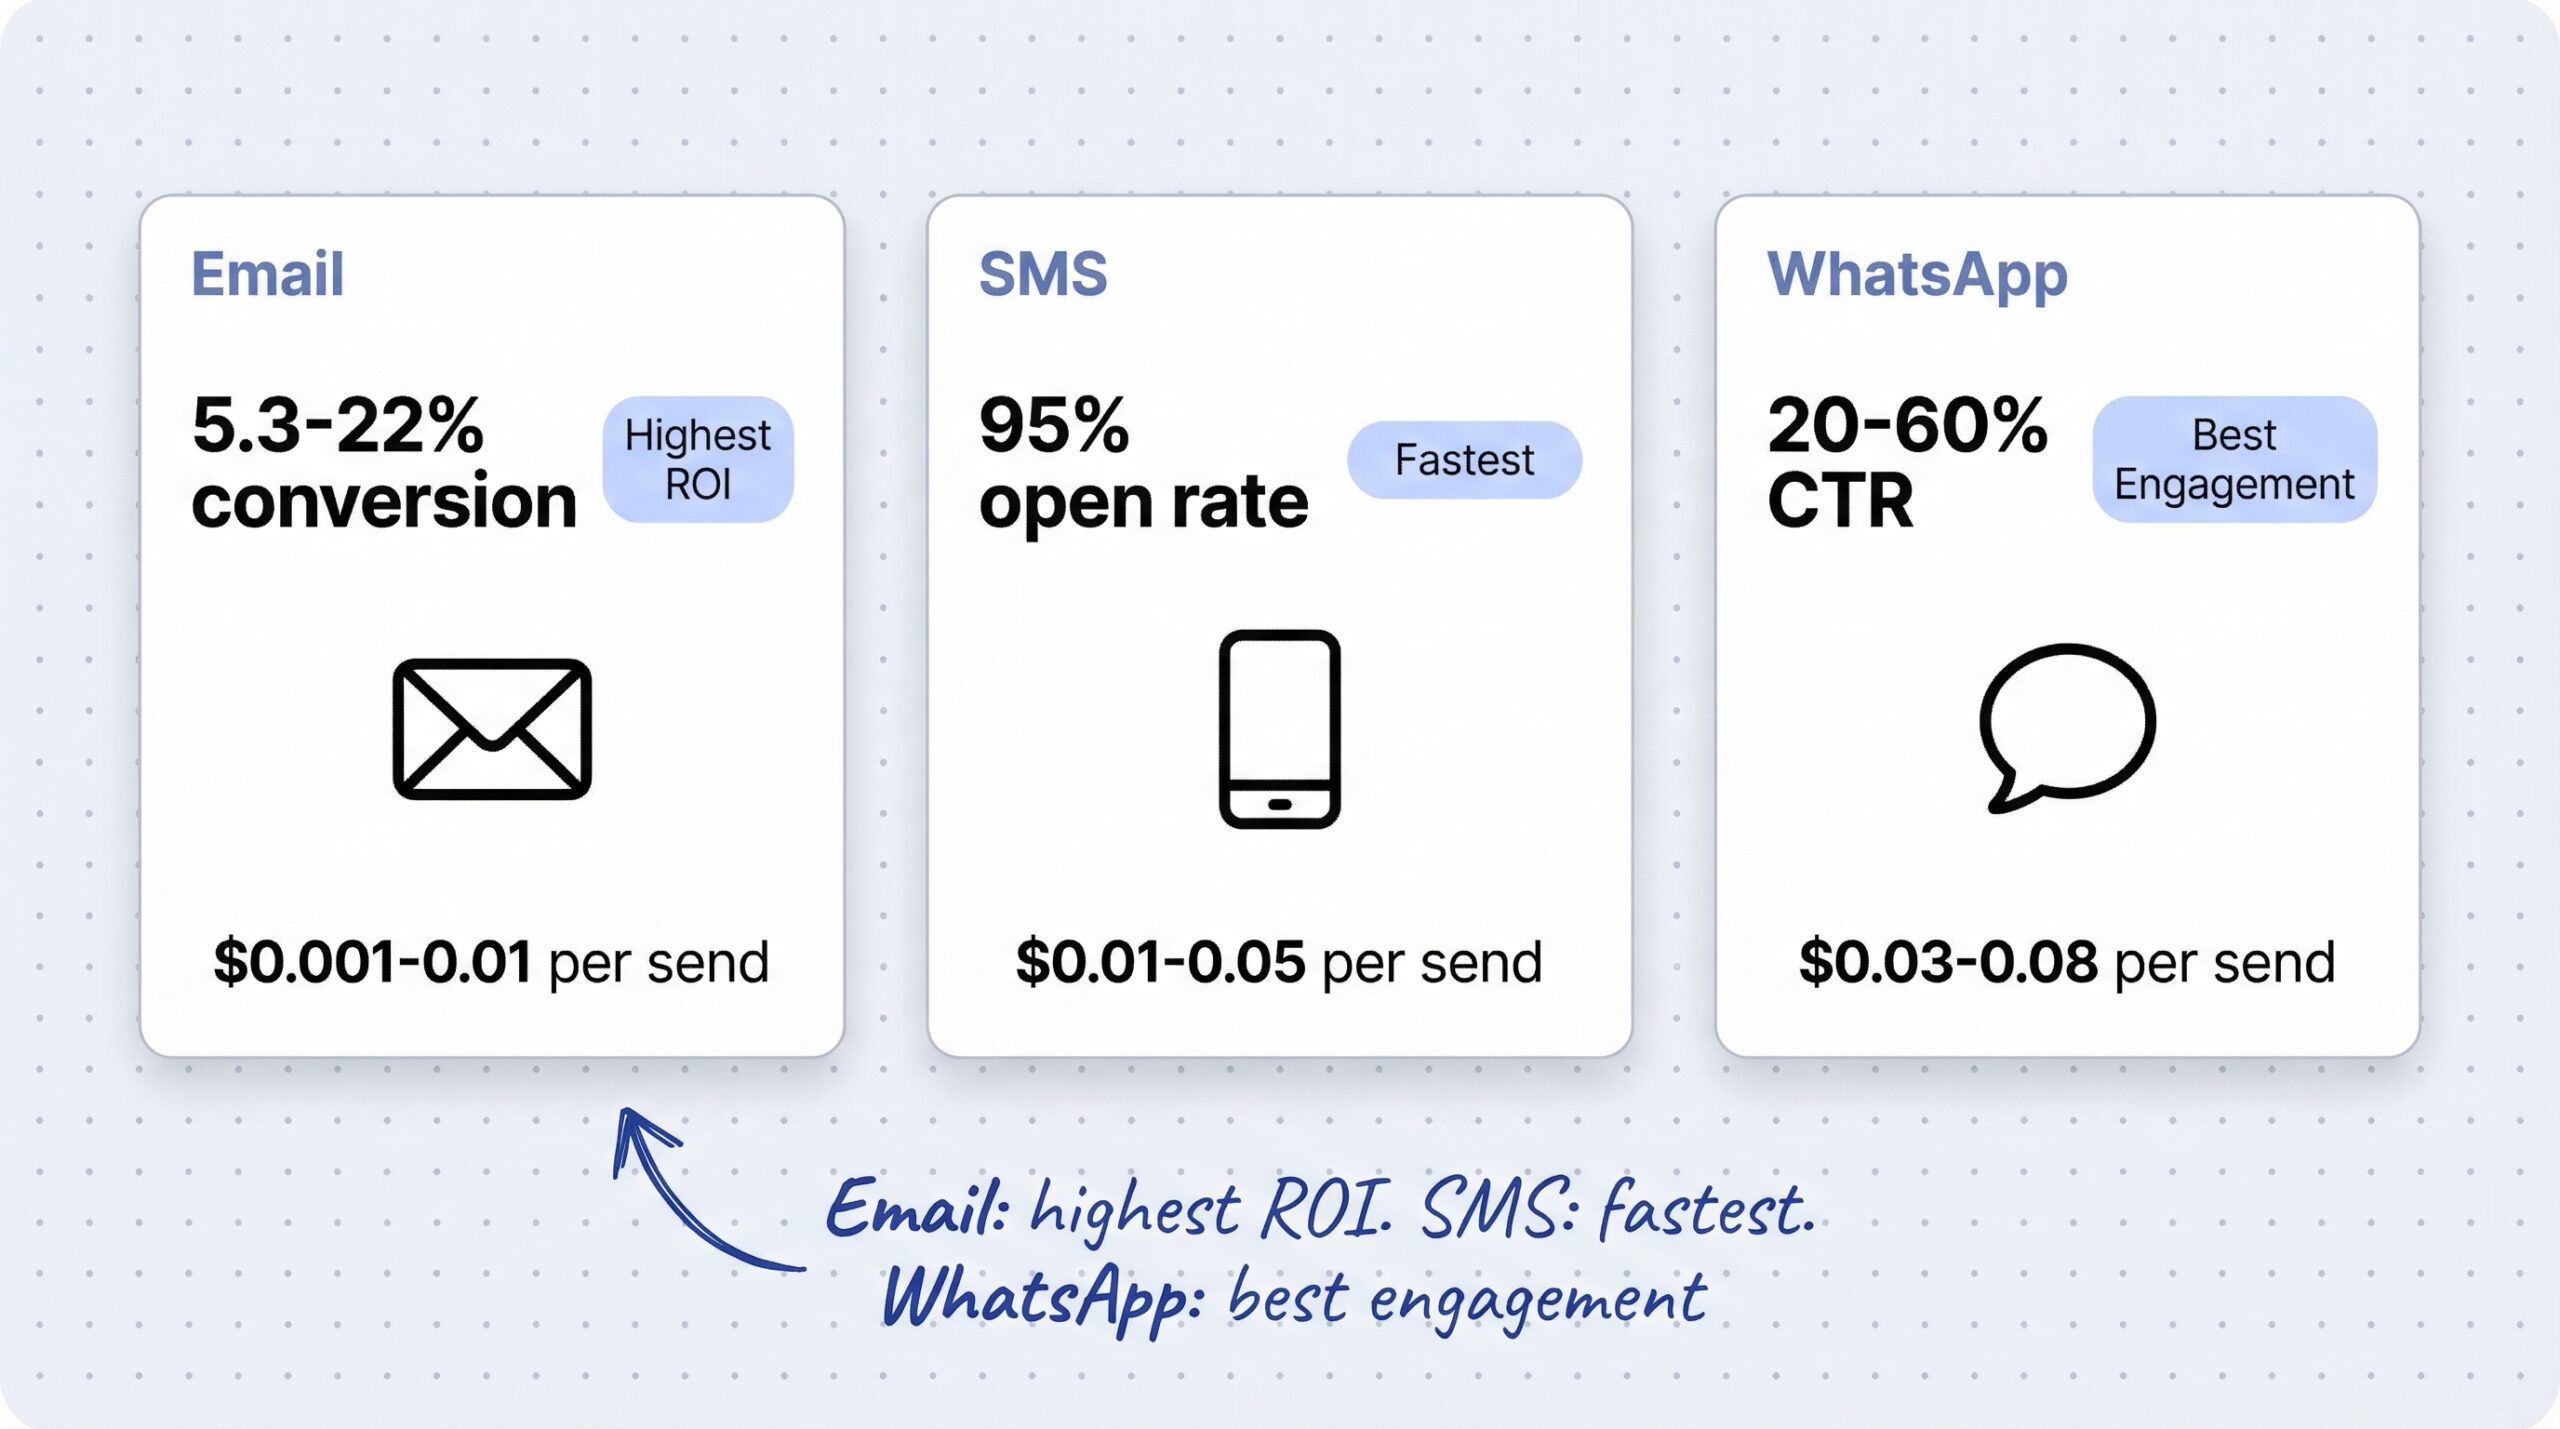
| Cost Per Message | $0.001-0.01 | $0.01-0.05 | $0.03-0.08 |
| Speed to Open | Hours | Minutes | Under 5 min |
| Content Richness | Highest | Lowest | Medium |
| Opt-Out Risk | Low | Medium | Low |
A few things jump out from this comparison.
Email has the highest proven conversion rate ceiling (22%) and the lowest cost per message. It is the foundation channel. SMS has the fastest delivery and highest guaranteed visibility, but click rates are lower and costs are 10-50x higher than email. WhatsApp sits in between, with strong click rates and fast delivery, but conversion data is still maturing.
The best-performing stores do not pick one channel. They use all three in a multichannel restock notification sequence that plays to each channel’s strength.
Yes, and this is the data point nobody publishes because it is hard to segment. Here is what we can piece together from Klaviyo’s industry data and general ecommerce benchmarks.
Smaller stores typically see higher open and click rates but lower overall conversion rates. Why? Their subscriber lists are smaller and more engaged, but their product pages may not be as optimized for conversion.
| Metric | Expected Range | Why |
|---|---|---|
| Email Open Rate | 60-70% | Smaller lists, more engaged |
| Email Click Rate | 22-28% | Higher familiarity with brand |
| Email Conversion Rate | 4-6% | Product page optimization gap |
| Subscriber Growth | Slower absolute, faster % | Fewer products to trigger signups |
Mid-size stores often hit the sweet spot. They have enough subscribers to generate meaningful revenue from restock alerts, and enough operational maturity to optimize the experience.
| Metric | Expected Range | Why |
|---|---|---|
| Email Open Rate | 55-65% | Larger list, slightly lower engagement per subscriber |
| Email Click Rate | 20-25% | More products, more varied intent |
| Email Conversion Rate | 5-8% | Better product pages, more social proof |
| Subscriber Growth | Steady, compounding | More SKUs create more signup opportunities |
Larger stores benefit from volume. Even if per-subscriber metrics dip slightly, the absolute revenue from restock alerts grows substantially.
| Metric | Expected Range | Why |
|---|---|---|
| Email Open Rate | 50-60% | List fatigue from higher email volume |
| Email Click Rate | 18-22% | Broader catalog dilutes focus |
| Email Conversion Rate | 6-10% | Optimized pages, faster restocking cycles |
| Subscriber Growth | High volume, critical mass | Large catalogs generate continuous signups |
The key takeaway: do not compare your small store’s numbers against enterprise benchmarks. Measure against your own tier and focus on improvement trajectory.
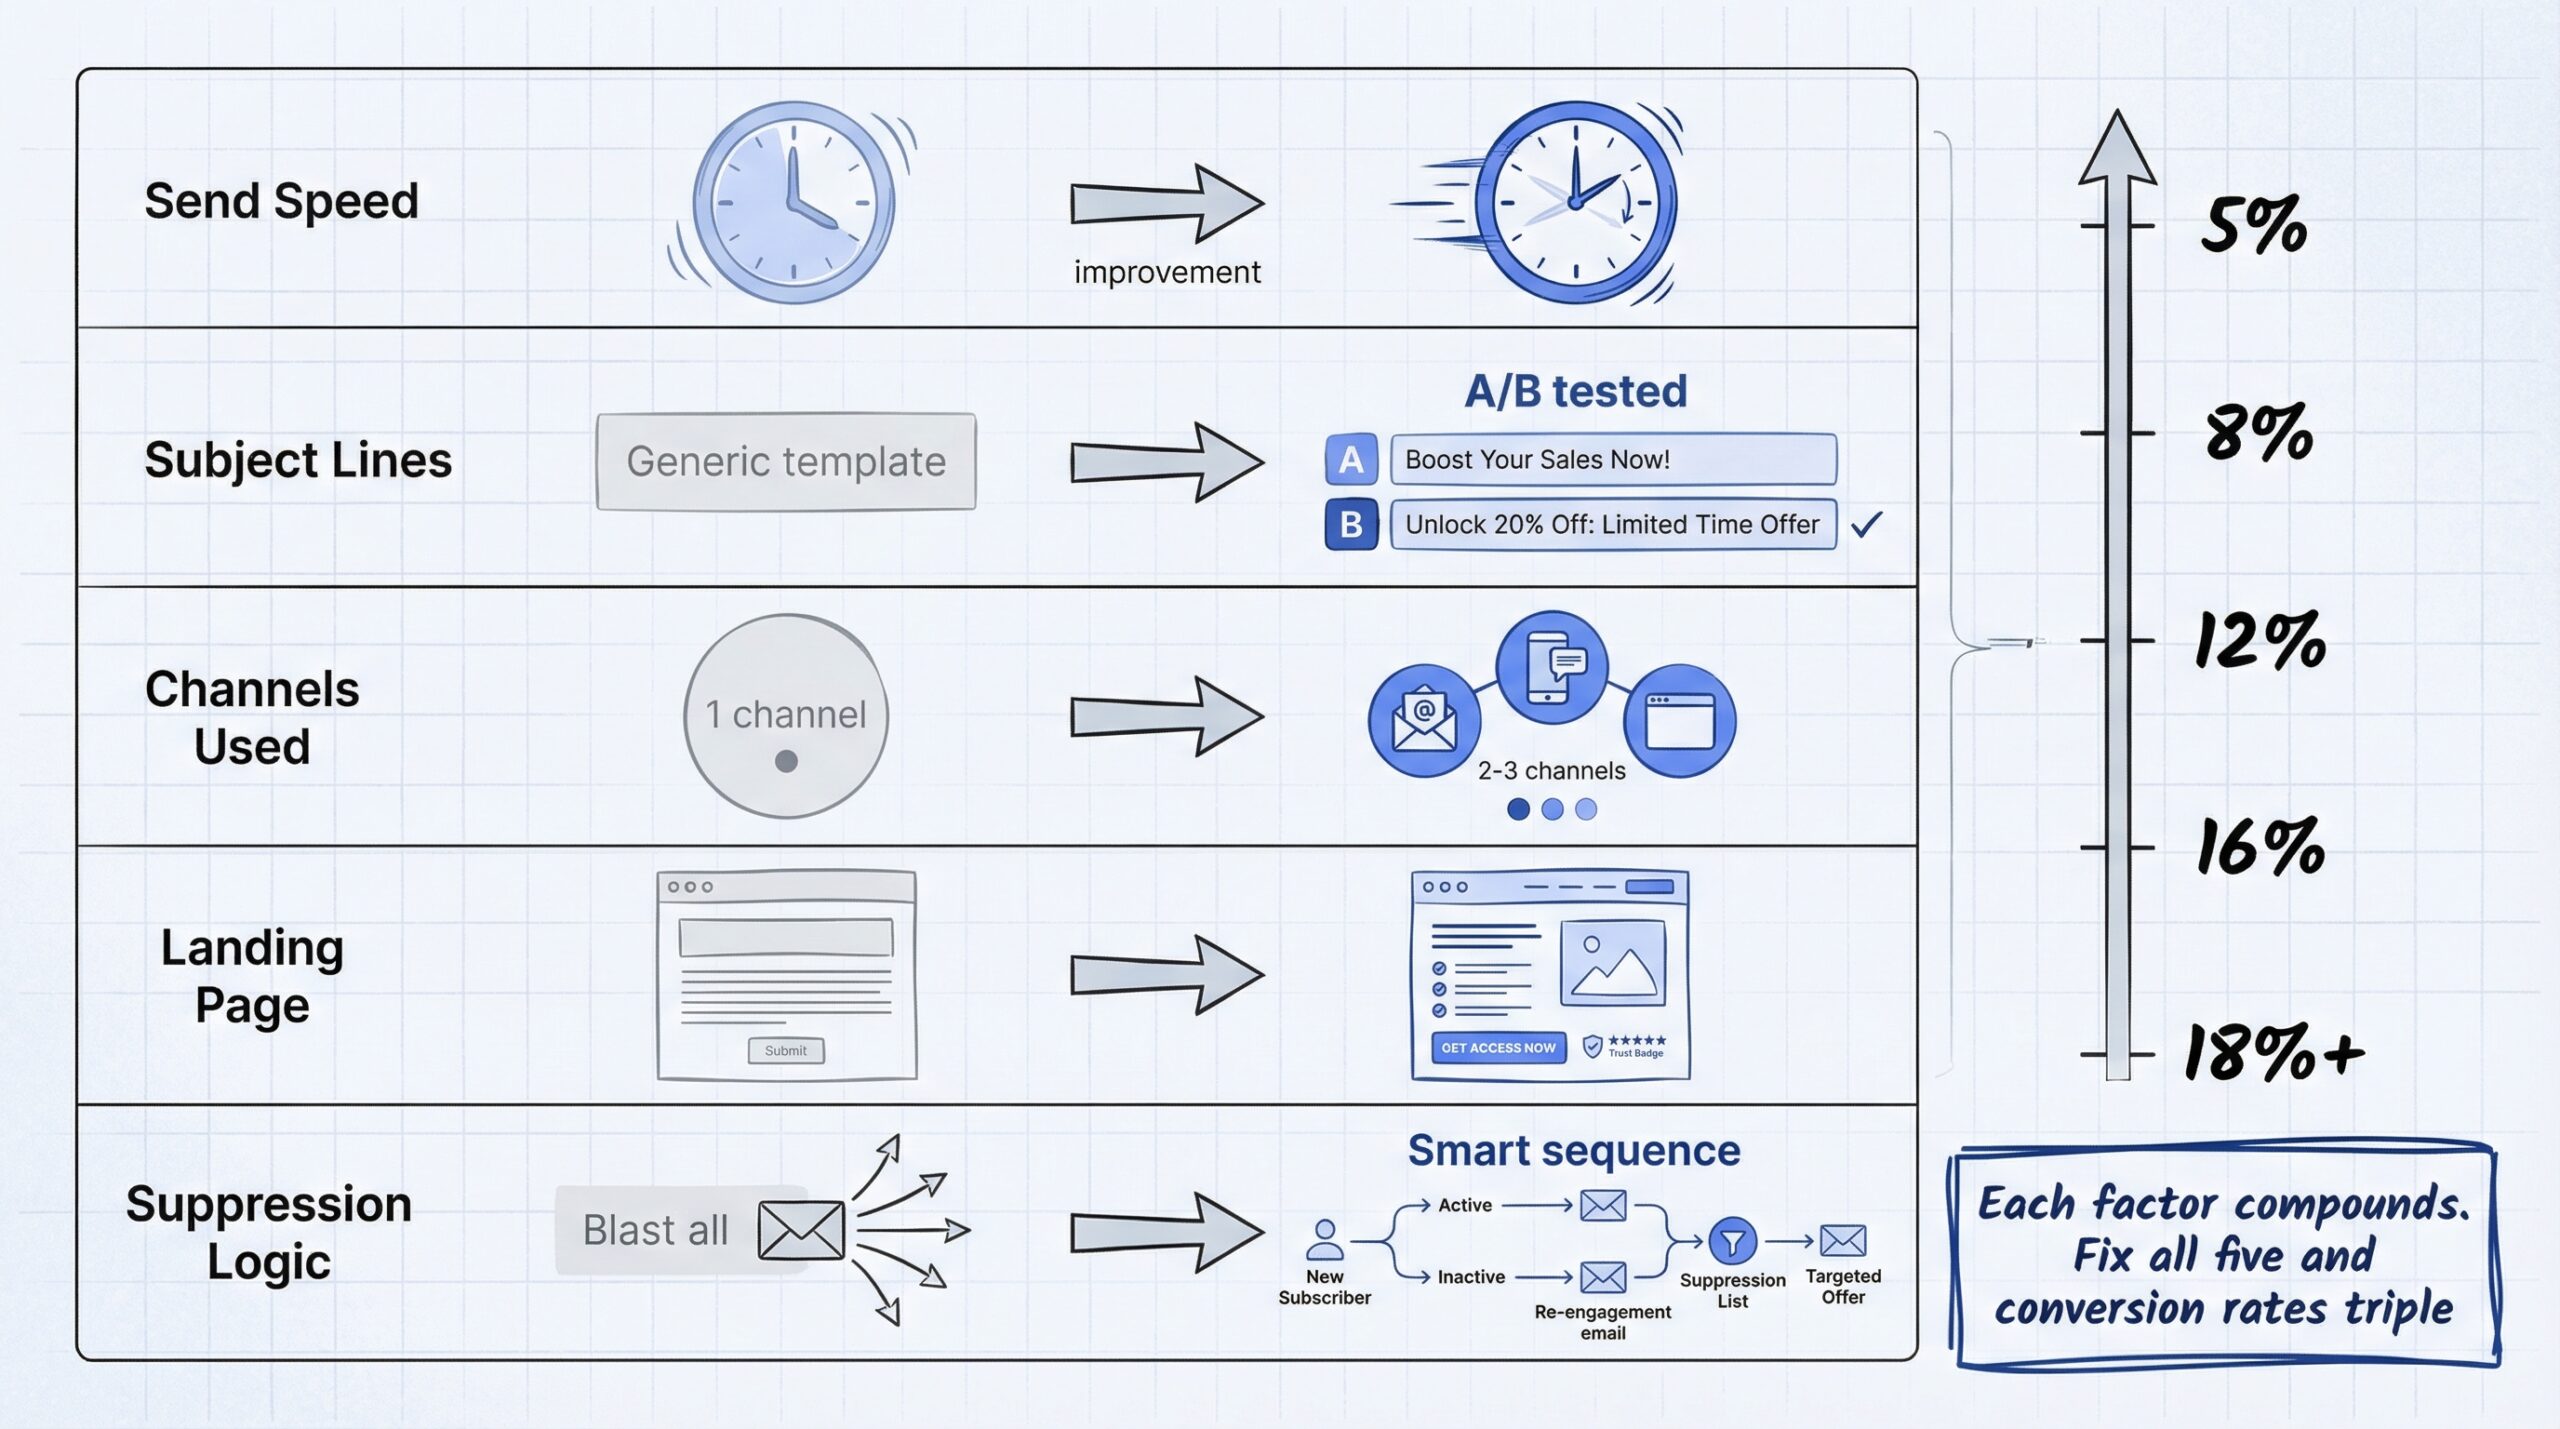
The gap between a 5% conversion rate and an 18% conversion rate is not random. Top performers consistently do five things differently.
1. They send fast. The best stores trigger restock alerts within minutes of inventory hitting their warehouse. Every hour of delay costs conversions. Between 21-41% of subscribers buy from a competitor before receiving a notification, according to Postscript’s SMS ecommerce benchmarks.
2. They write better subject lines. Open rates determine everything downstream. A 10% improvement in open rate cascades into proportional improvements in clicks and conversions. Top stores A/B test every restock subject line.
3. They use multiple channels. Dual-channel subscribers generate 2.0-2.8x more revenue than single-channel subscribers, according to Attentive’s SMS and email orchestration data. Email plus SMS or WhatsApp consistently outperforms email alone.
4. They optimize the landing page. The restock email is half the battle. The product page needs to convert when the subscriber arrives. Stock indicators, social proof, and a fast checkout matter as much as the notification itself.
5. They suppress smartly. Top stores do not blast all channels simultaneously. They sequence notifications and suppress subsequent messages once a purchase is made. This keeps opt-out rates low and subscriber quality high.
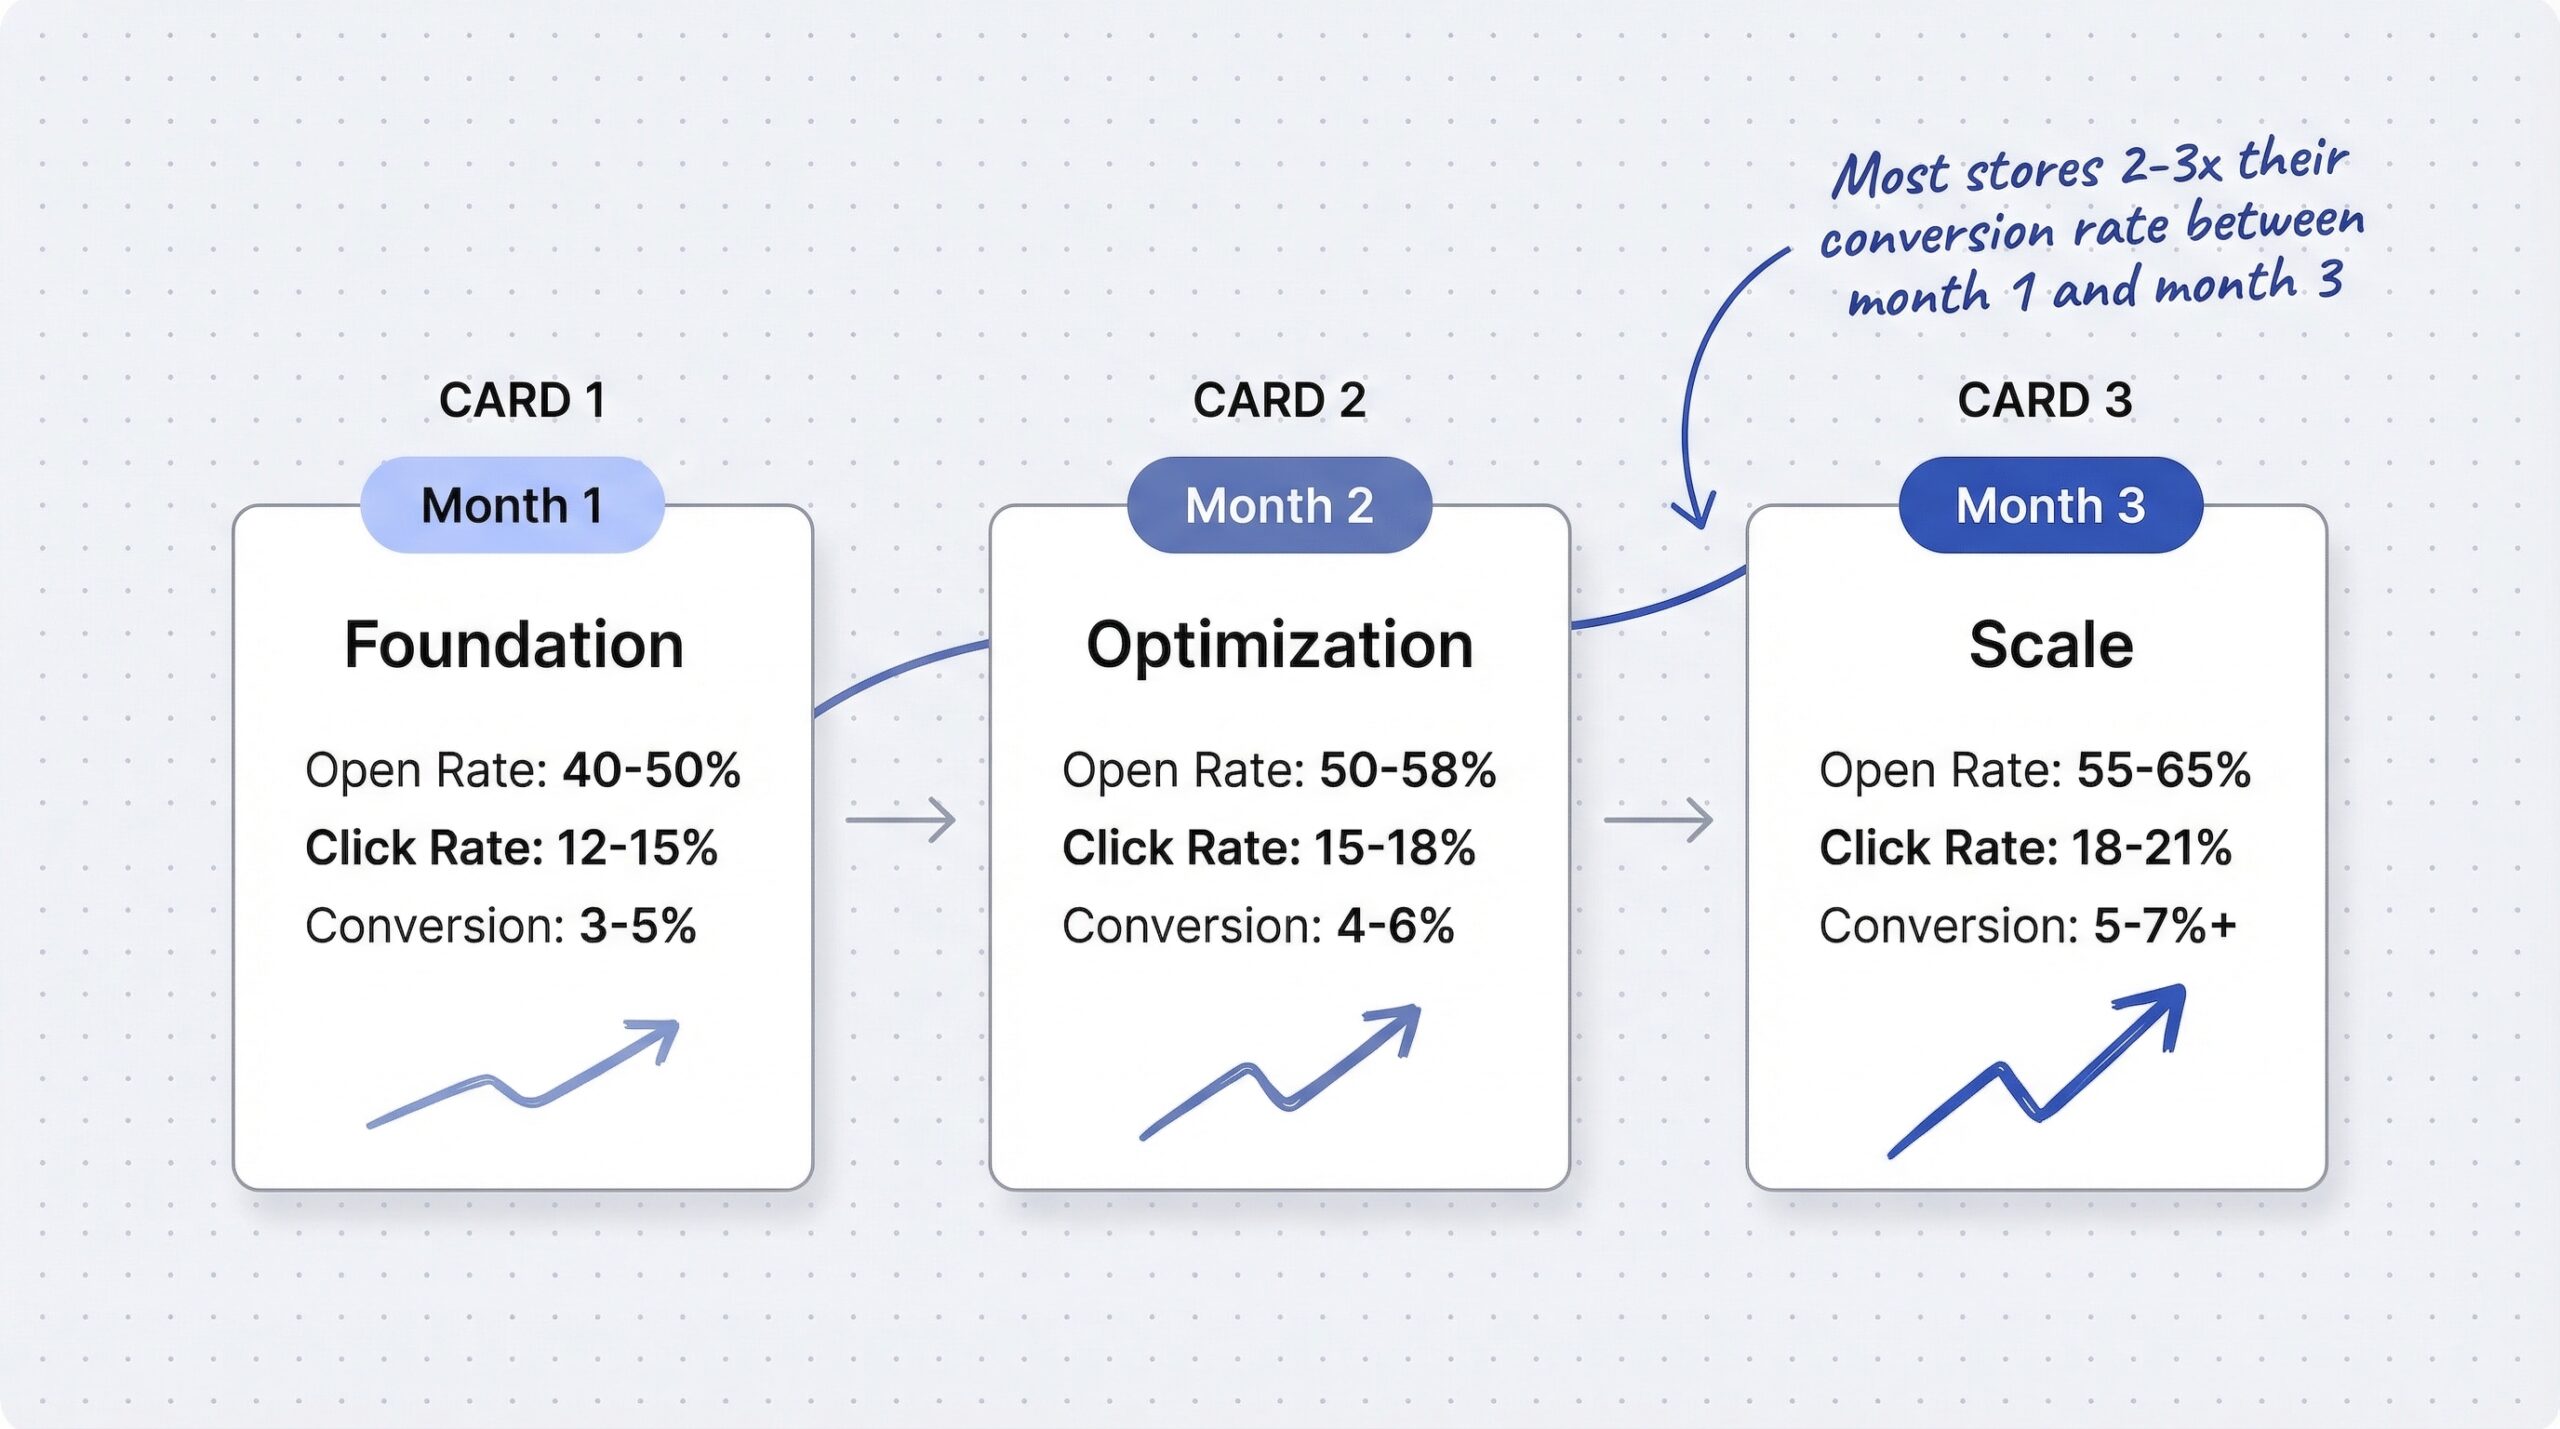
If you are just getting started with back-in-stock notification apps like StoreBeep, here is a realistic target framework based on restock notification conversion rate 2026 benchmarks across the industry.
Focus on getting the basics right. Install a back-in-stock notification app, customize your signup form, and start collecting subscribers.
| Metric | Month 1 Target | What To Watch |
|---|---|---|
| Email Open Rate | 40-50% | If below 40%, check your subject lines and sender domain |
| Email Click Rate | 12-15% | If below 12%, review your email template and CTA placement |
| Email Conversion Rate | 3-5% | If below 3%, optimize your product page |
| Subscriber Signups | Baseline measurement | Track signups per product per week |
Start testing. Try different subject line formulas, send times, and email designs. Add a second channel if you have the infrastructure.
| Metric | Month 2 Target | What To Watch |
|---|---|---|
| Email Open Rate | 50-58% | A/B test subject lines and preview text |
| Email Click Rate | 15-18% | Test product images and CTA buttons |
| Email Conversion Rate | 4-6% | Review product page conversion rate separately |
| Subscriber Growth | +30-50% over month 1 | If flat, check “Notify Me” button placement |
By now you should have enough data to identify your best and worst performing products, subject lines, and send times. Double down on what works.
| Metric | Month 3 Target | What To Watch |
|---|---|---|
| Email Open Rate | 55-65% | Should approach industry average |
| Email Click Rate | 18-21% | Should approach industry average |
| Email Conversion Rate | 5-7%+ | If not improving, dig into conversion rate drop-off analysis |
| Revenue Attribution | Track total recovered revenue | Calculate your restock notification ROI |
Most benchmarks come from cross-platform data. Omnisend’s data covers 150,000+ brands across Shopify, WooCommerce, BigCommerce, and other platforms. Shopify-specific performance tends to be slightly above average because of the platform’s strong checkout experience.
The 95-98% figures come from self-reported surveys and marketing materials. The 60-68% number comes from Braze’s enterprise data measuring actual verified read receipts. The real number is probably somewhere in between, depending on your subscriber quality and message relevance.
Higher-priced products tend to have lower conversion rates but higher revenue per notification. A $20 product might convert at 8%, while a $200 product converts at 3%, but the $200 product generates more revenue per send. Track revenue per notification, not just conversion rate.
Start with industry averages as your baseline. Once you consistently hit those, aim for top-25% performance. Top-10% numbers require significant optimization across subject lines, email design, product pages, and multi-channel coordination.
At least 100 subscribers who have received a back-in-stock notification. Below that threshold, a single purchase can swing your conversion rate by several percentage points. Track trends over time rather than individual send performance until you have volume.
Yes. Fashion and apparel tend to have higher open rates because of style-driven urgency. Electronics have lower open rates but higher conversion rates because buyers are more research-complete. Beauty sits in between with strong performance across all metrics.
Monthly for the first six months, then quarterly. Review after every major change to your notification setup, product page design, or pricing strategy. Seasonal patterns also affect benchmarks, so compare similar months year over year.
StoreBeep tracks key metrics including subscriber signups, notification sends, open rates, and purchase conversions through its demand insights dashboard. You can see which products generate the most signups and which alerts drive the most revenue.
The back-in-stock notification benchmarks 2026 paint a clear picture. Email converts at 5-6% on average but top stores hit 18-22%. SMS delivers speed with 95% visibility. WhatsApp offers strong engagement at 60-68% verified read rates.
But benchmarks are only useful if you measure against them. Start tracking your open rate, click rate, conversion rate, and revenue per notification this week. Compare against the channel-specific benchmarks in this article. Identify the gaps.
Then close them.
The stores that treat restock alert performance data as a living dashboard, not a one-time report, are the ones that end up in the top 10%. Every percentage point of improvement compounds across every restock event, every subscriber, and every product in your catalog.
Keep reading