March 3, 2026 · Gaurav Radadiya
Your restock notifications are sending emails and recovering some sales. But when someone asks “what is the ROI of those alerts?” you probably reach for open rates and signup counts. Those are activity metrics, not revenue metrics. They do not answer the question.
The real question is: for every dollar you spend on your back in stock alerts ROI on Shopify, how many dollars come back? The answer, for most programs, is overwhelmingly positive. Automated emails generate 30% of all email-attributed revenue from just 2% of total email send volume (Omnisend’s 2025 ecommerce marketing report). Back-in-stock alerts are one of the highest-performing automations in that category.
But “overwhelmingly positive” is not a number you can put in a report. This article gives you the formula, the benchmarks, and the reporting template to prove your back in stock alerts ROI on Shopify in actual dollars.
ROI for a back-in-stock program is not your open rate. It is not your signup count. It is a dollar calculation.
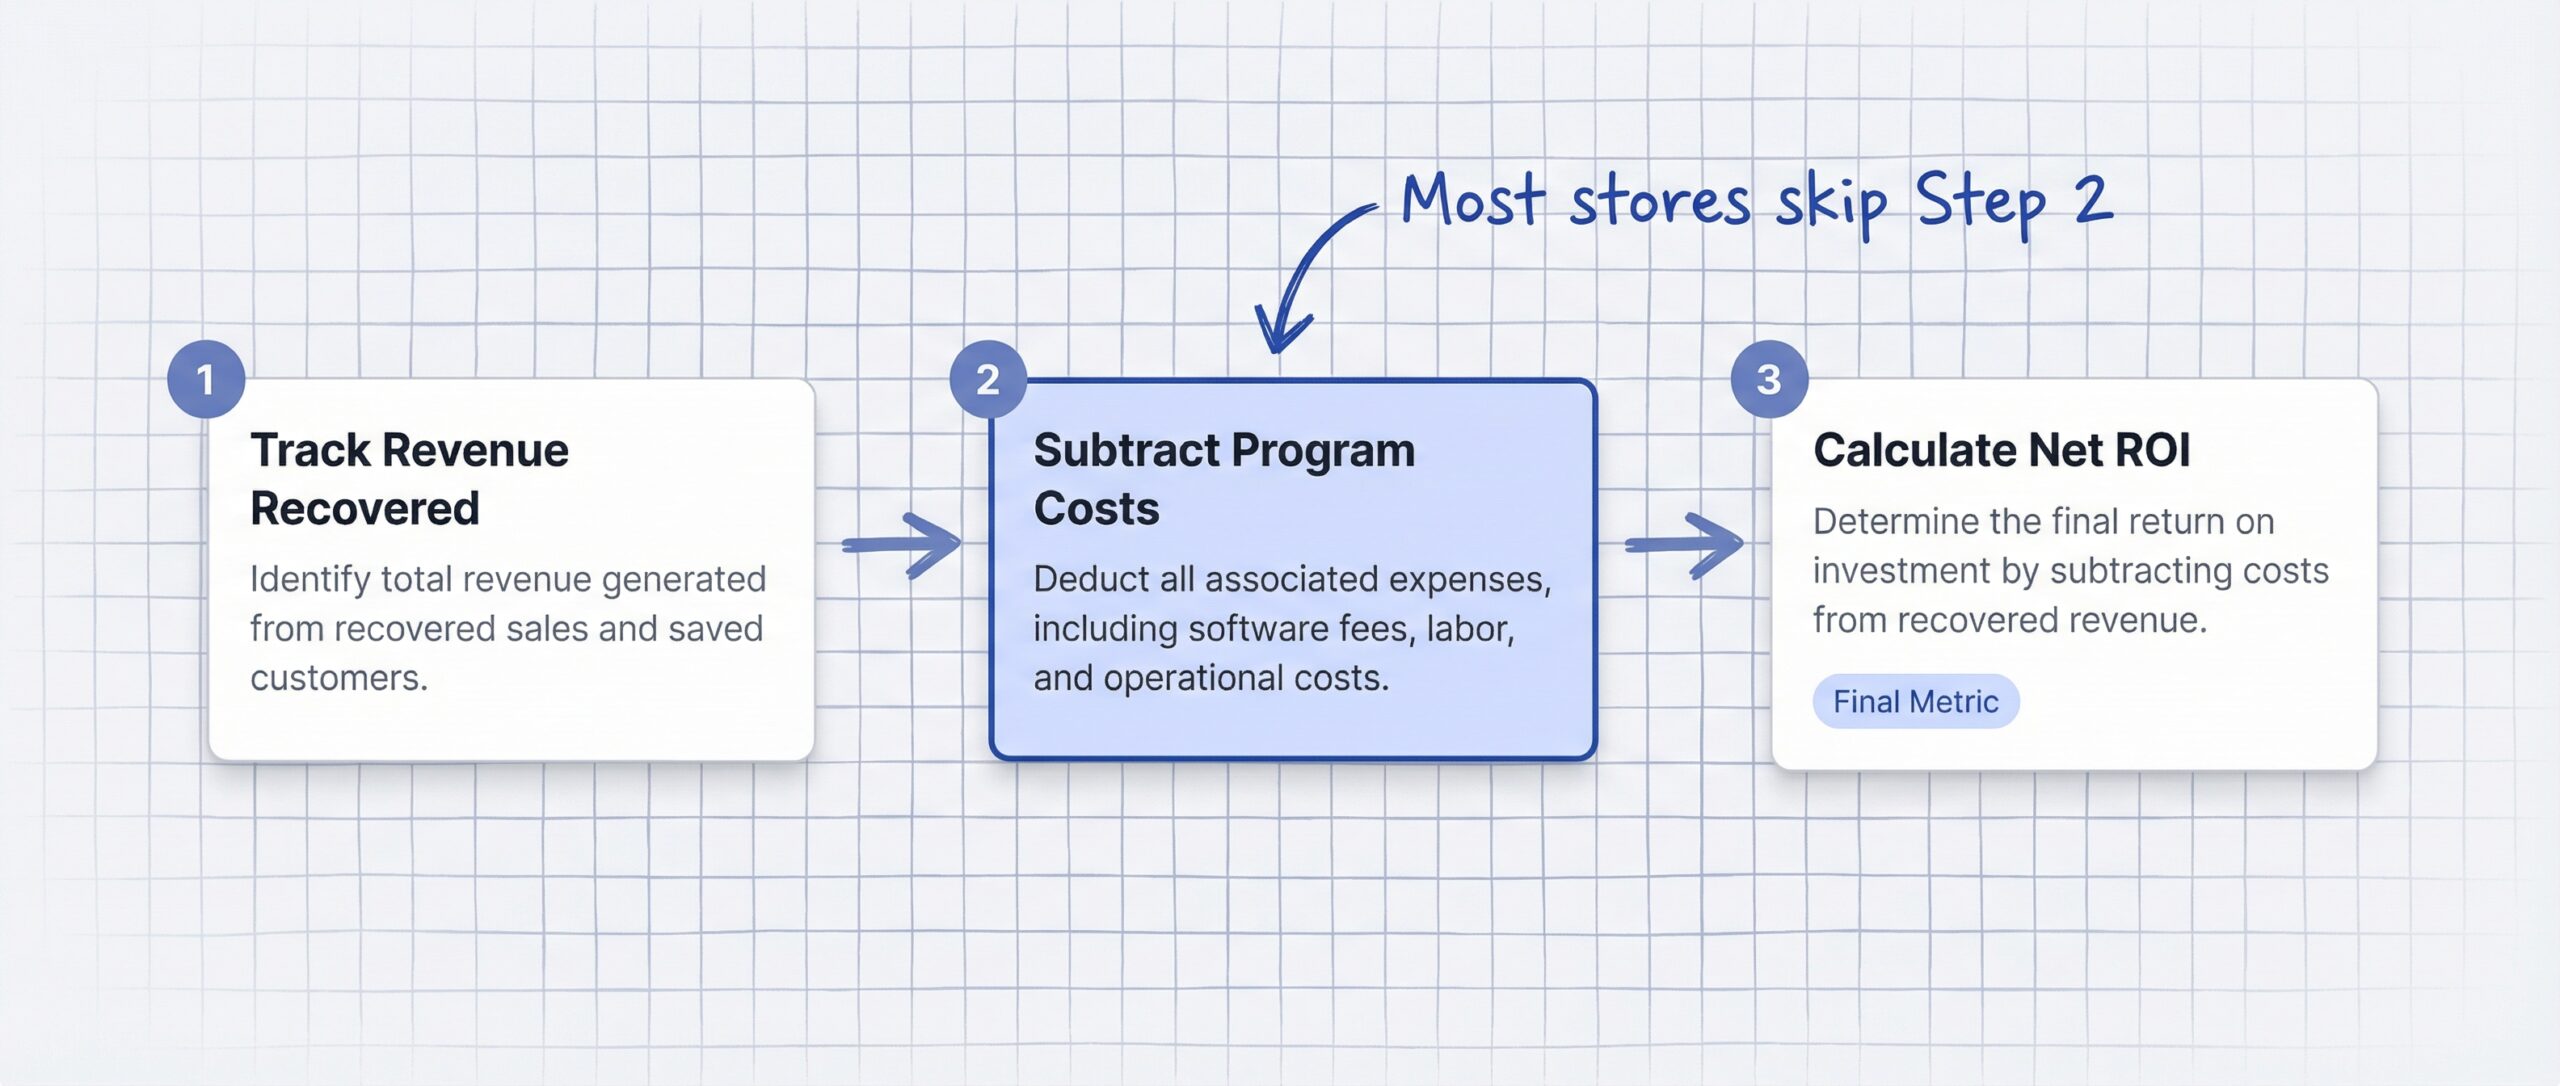
The formula:
Net ROI = (Revenue Recovered – Total Program Cost) / Total Program Cost x 100
Revenue Recovered is the total dollar value of orders placed by customers who clicked a restock notification and purchased within your attribution window.
Total Program Cost includes three things most merchants forget:
| Cost Component | Example |
|---|---|
| App subscription | $9.99-$29.99/month |
| Channel fees | SMS at $0.01-0.05/send, email platform costs |
| Staff time | Time spent managing waitlists, reviewing reports |
For a typical Shopify store on a $19.99/month plan sending only email alerts, total program cost is roughly $20-30/month. If your alerts recover even $200/month in revenue, your ROI is 567-900%. That is the kind of number that makes the business case self-evident.
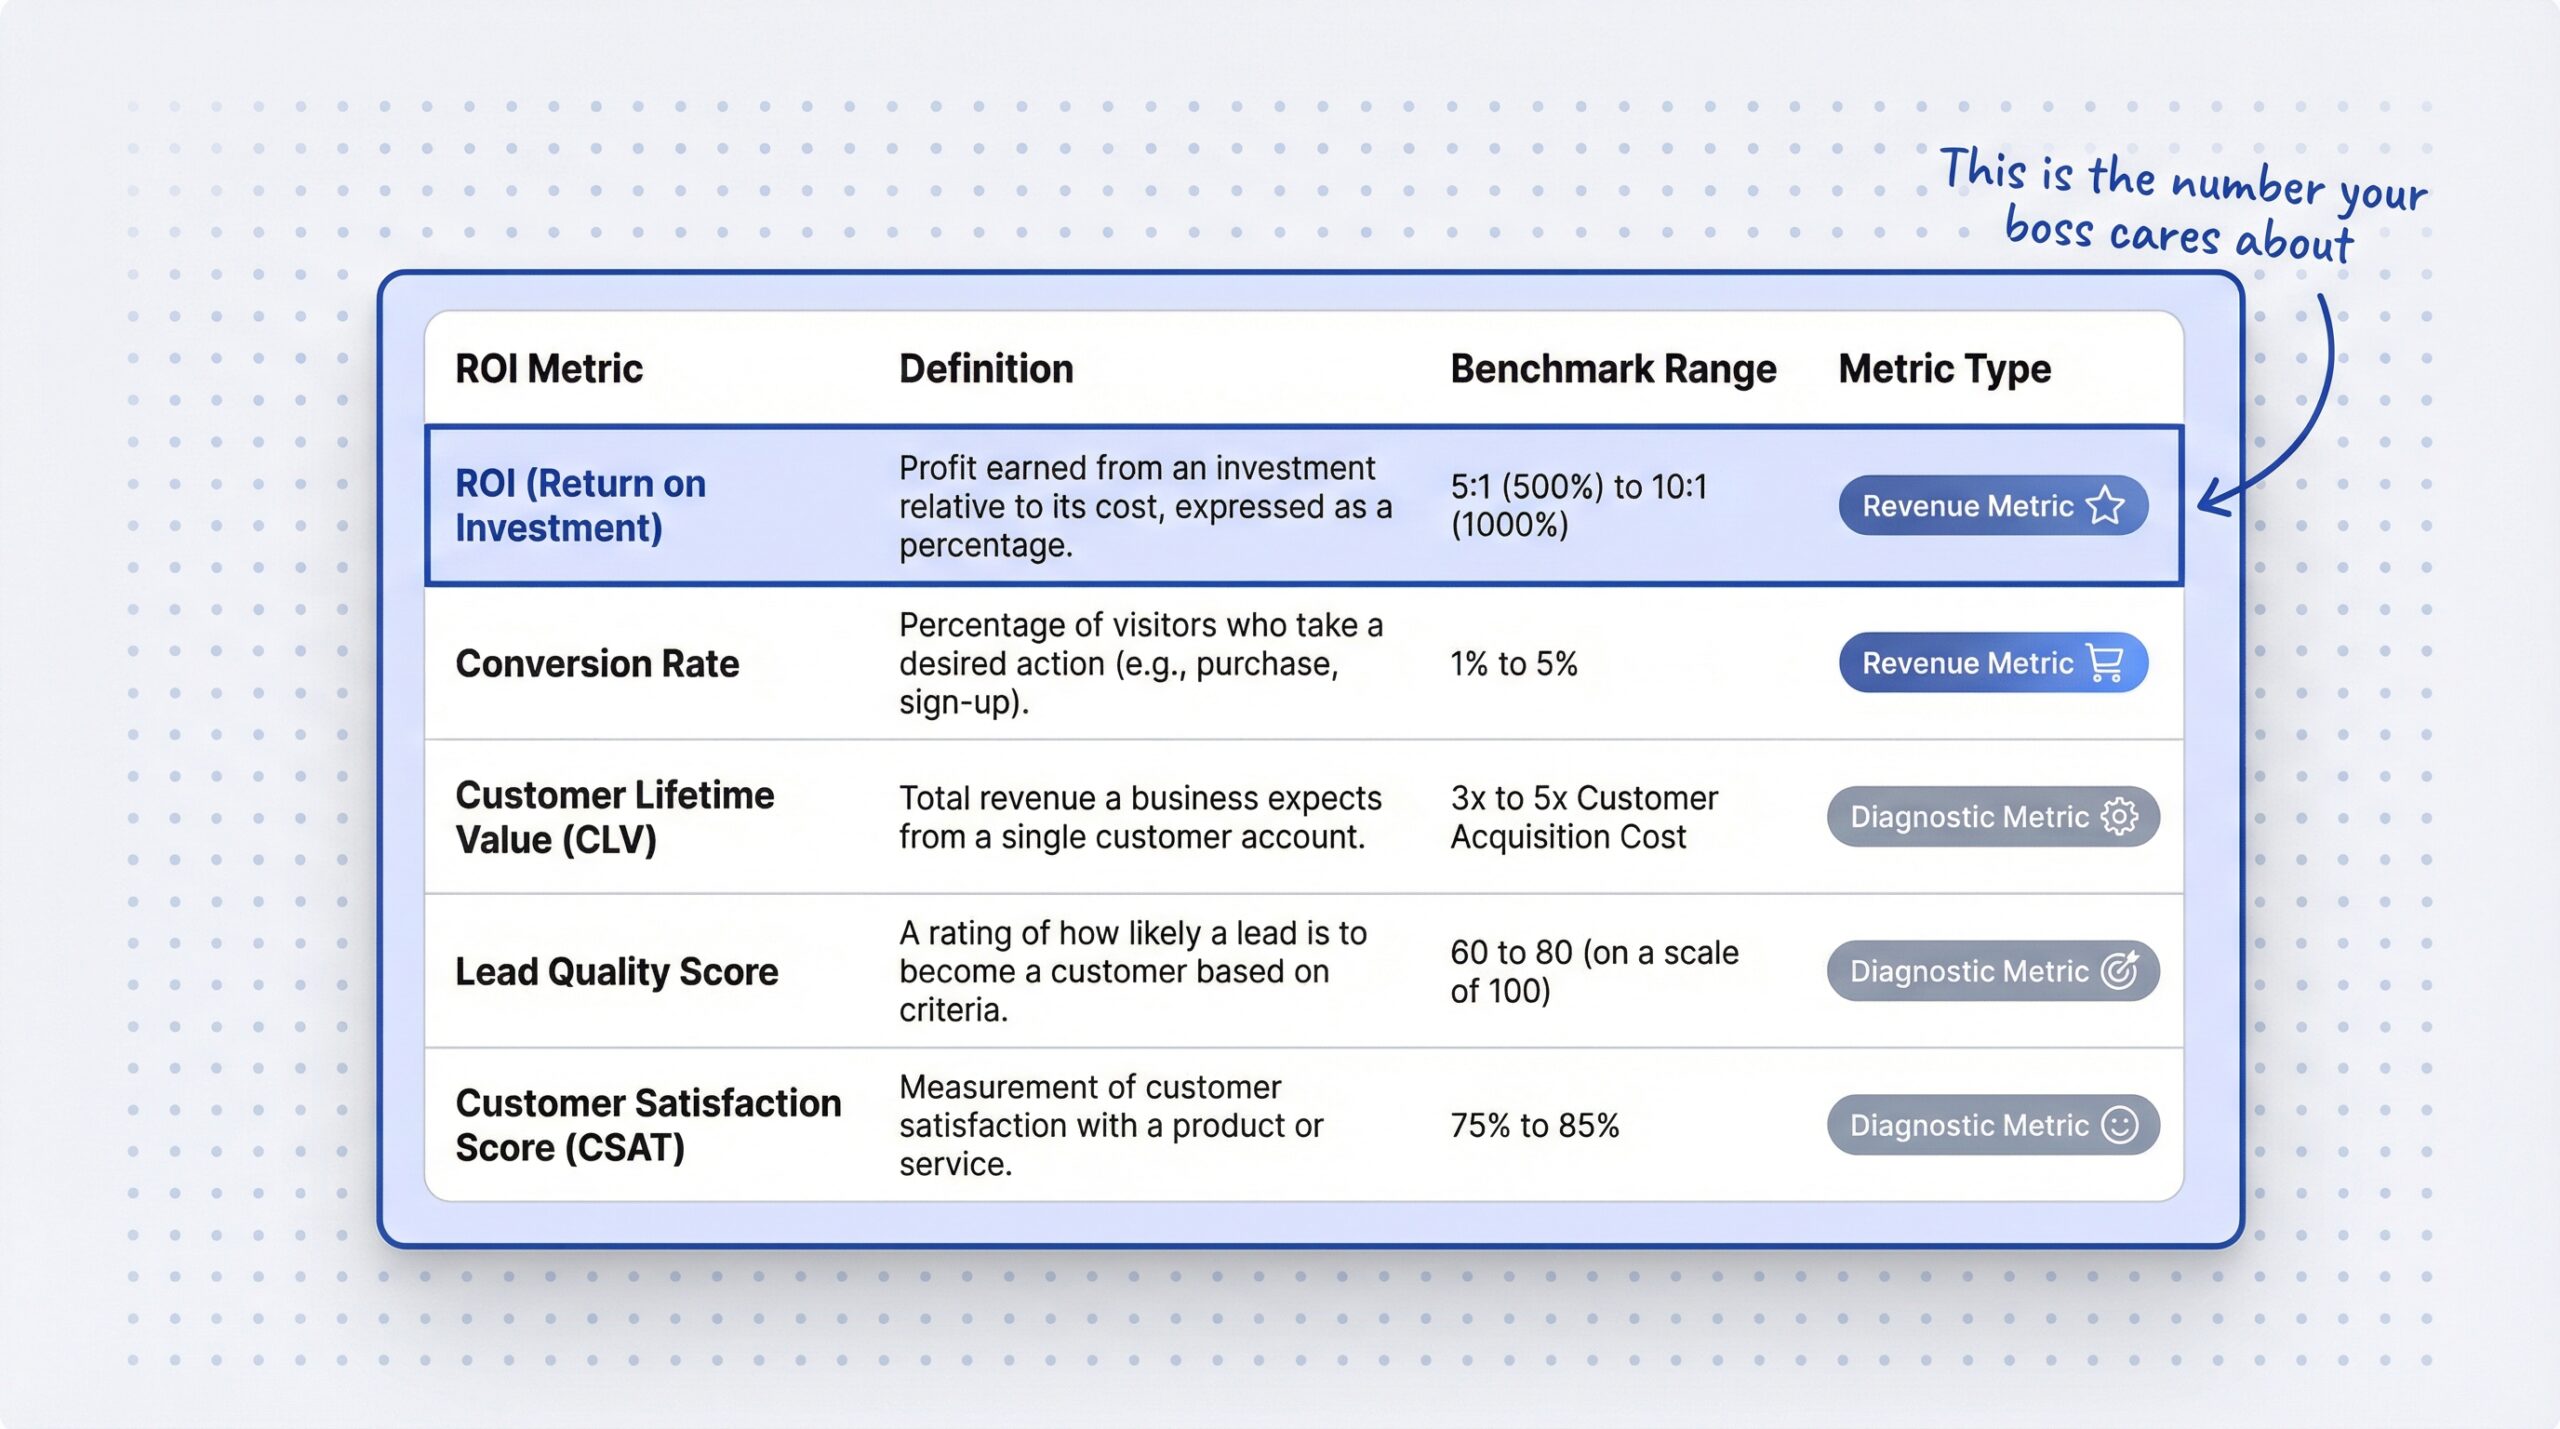
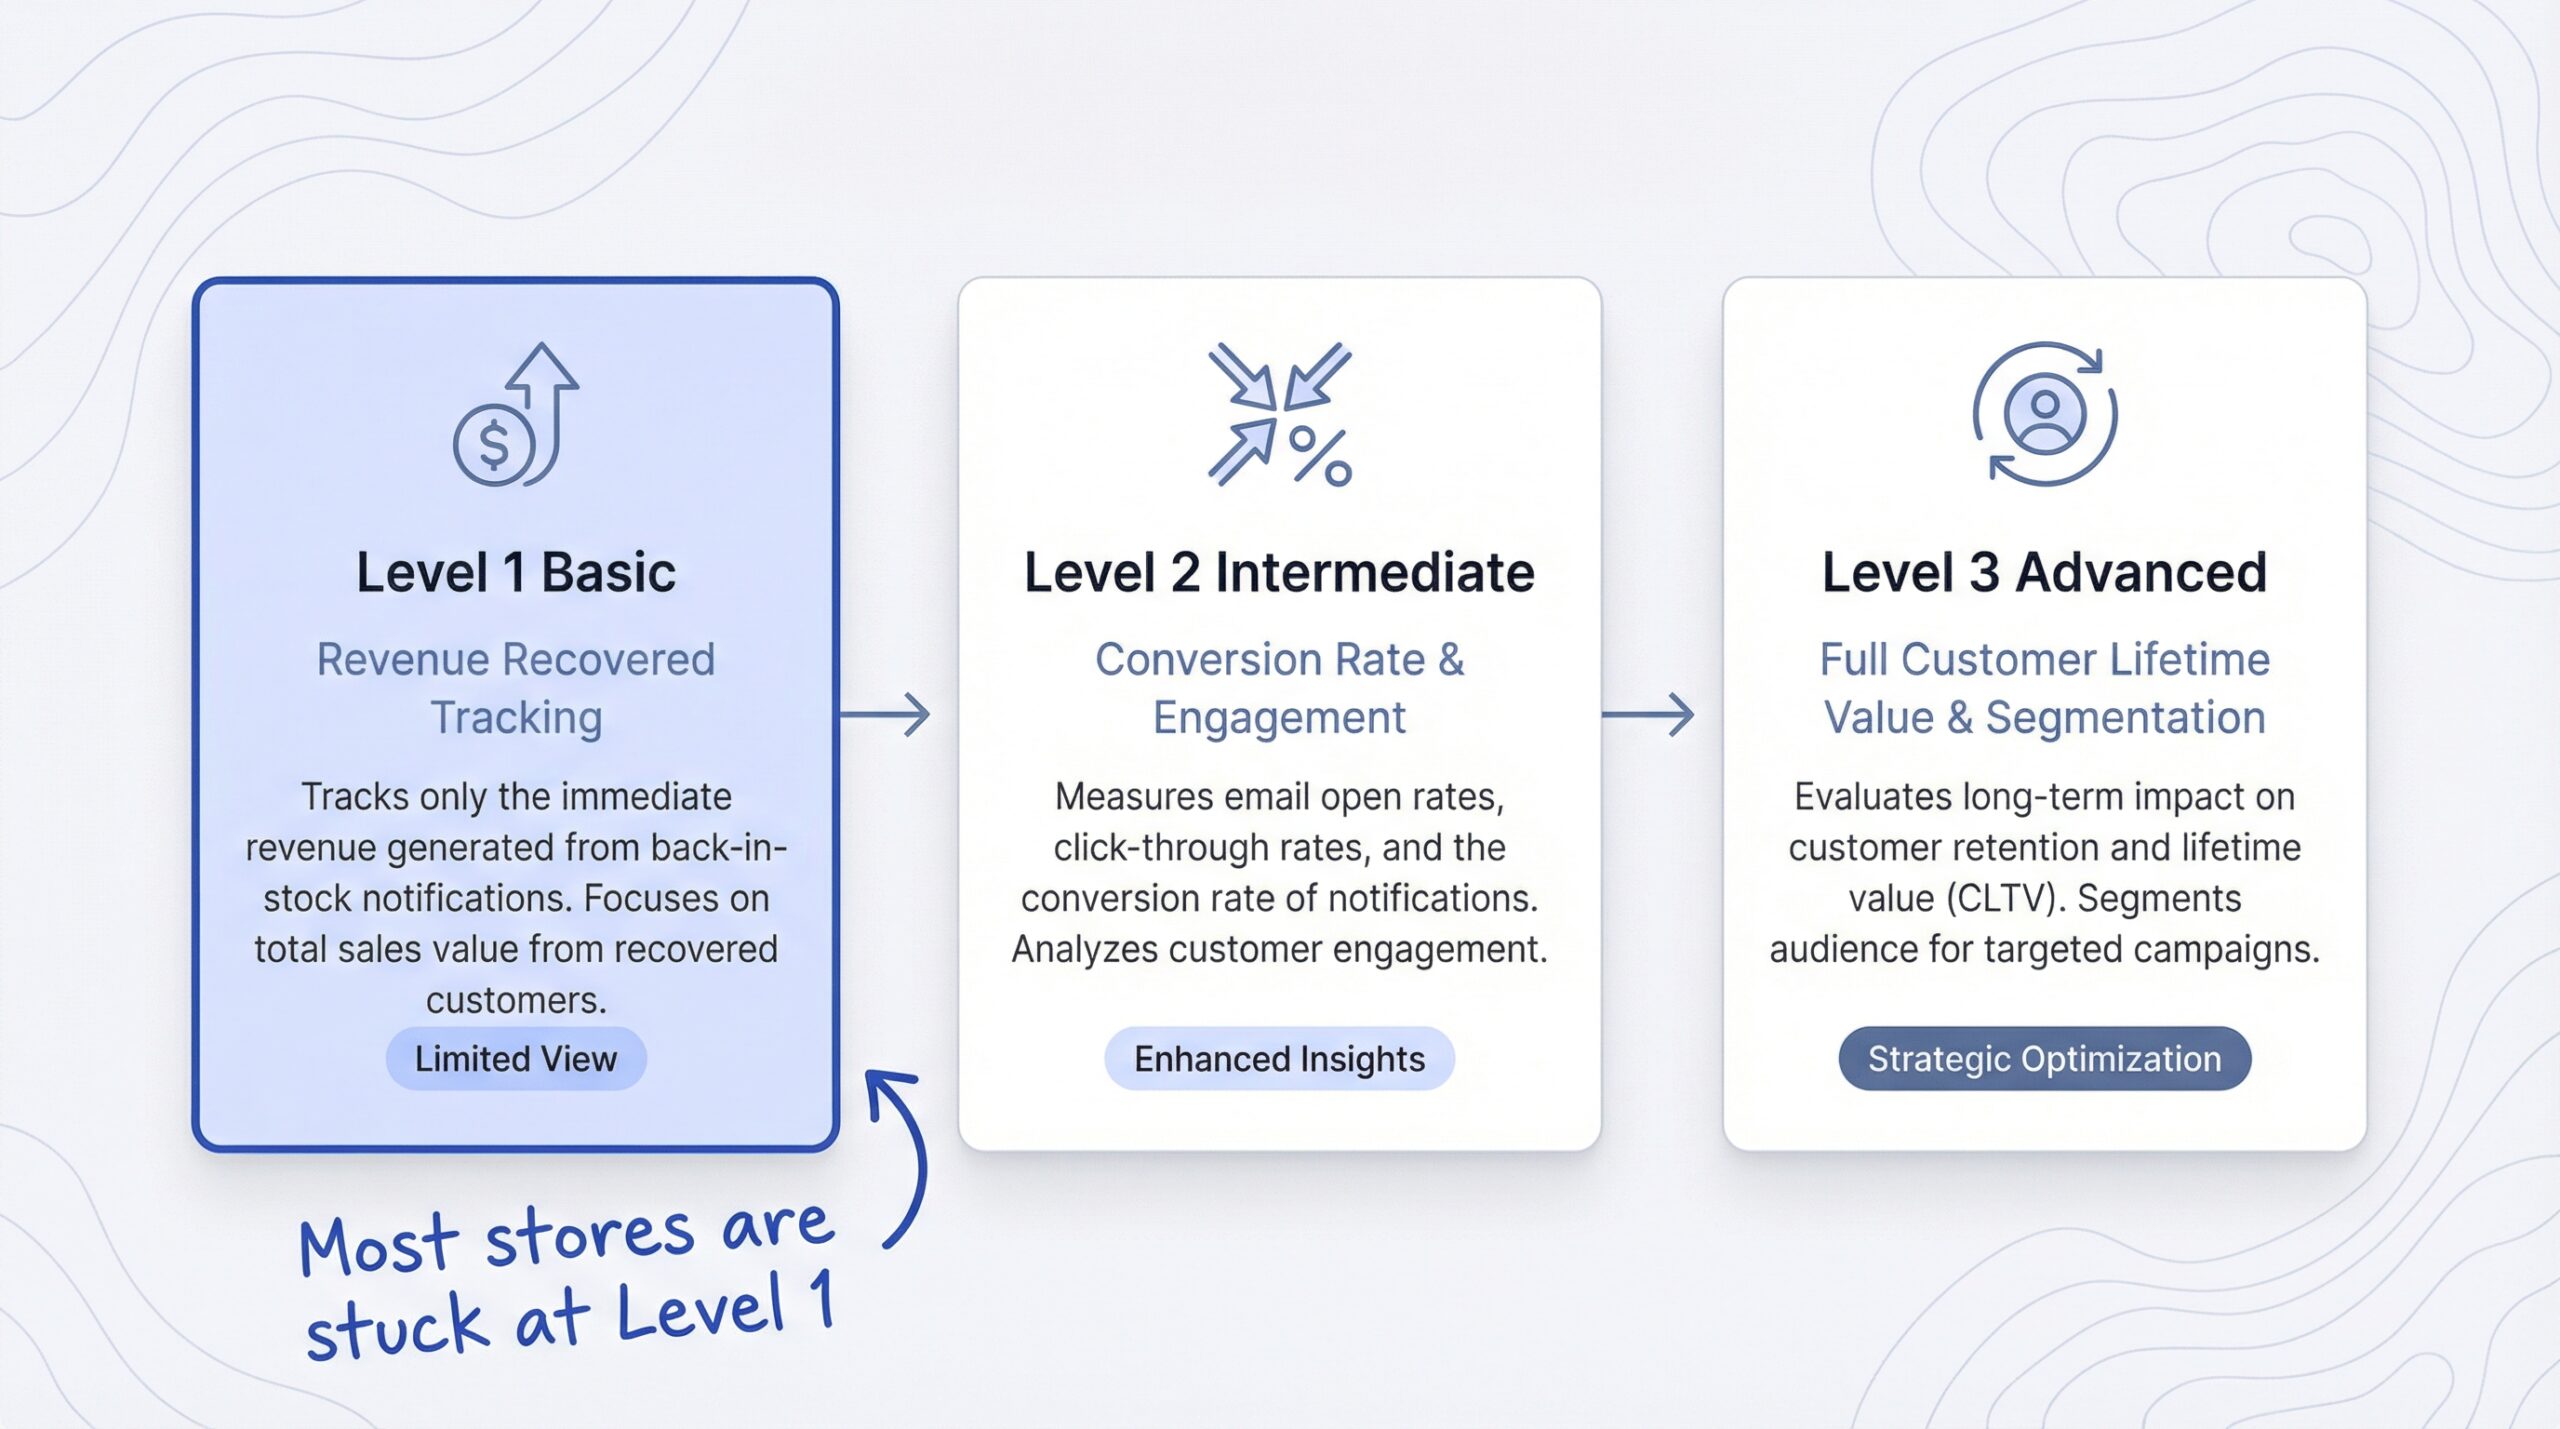
Forget open rates and click rates for the ROI conversation. Those are diagnostic metrics covered in our guide to back-in-stock conversion rate benchmarks for Shopify. For proving ROI, track these five:
| Metric | What It Measures | Good Benchmark |
|---|---|---|
| Revenue recovered | Total dollars from notification-driven purchases | Track monthly trend |
| Revenue per subscriber | Total recovered / total waitlist signups | $2-8 per subscriber |
| Cost per recovered sale | Total program cost / recovered orders | Under $5 |
| Subscriber-to-purchase rate | Signups that converted to orders | 5-10% |
| Subscriber CLV vs. non-subscriber CLV | Long-term value of alert subscribers vs. average customers | Subscribers 40%+ higher |
Revenue per subscriber is the most useful single metric. It tells you exactly what each waitlist signup is worth in dollars. If your revenue per subscriber is $5 and your back-in-stock program generates 100 new subscribers per month, you can forecast $500/month in recovered revenue with confidence.
48% of shoppers would sign up for restock alerts when encountering an out-of-stock product, and 69% abandon entirely without one (Opensend out-of-stock behavior statistics). Your notify-me button on Shopify is not just a convenience feature. It is a revenue capture mechanism with a measurable dollar-per-signup value, and the easiest way to measure back in stock notification performance across your ecommerce store.
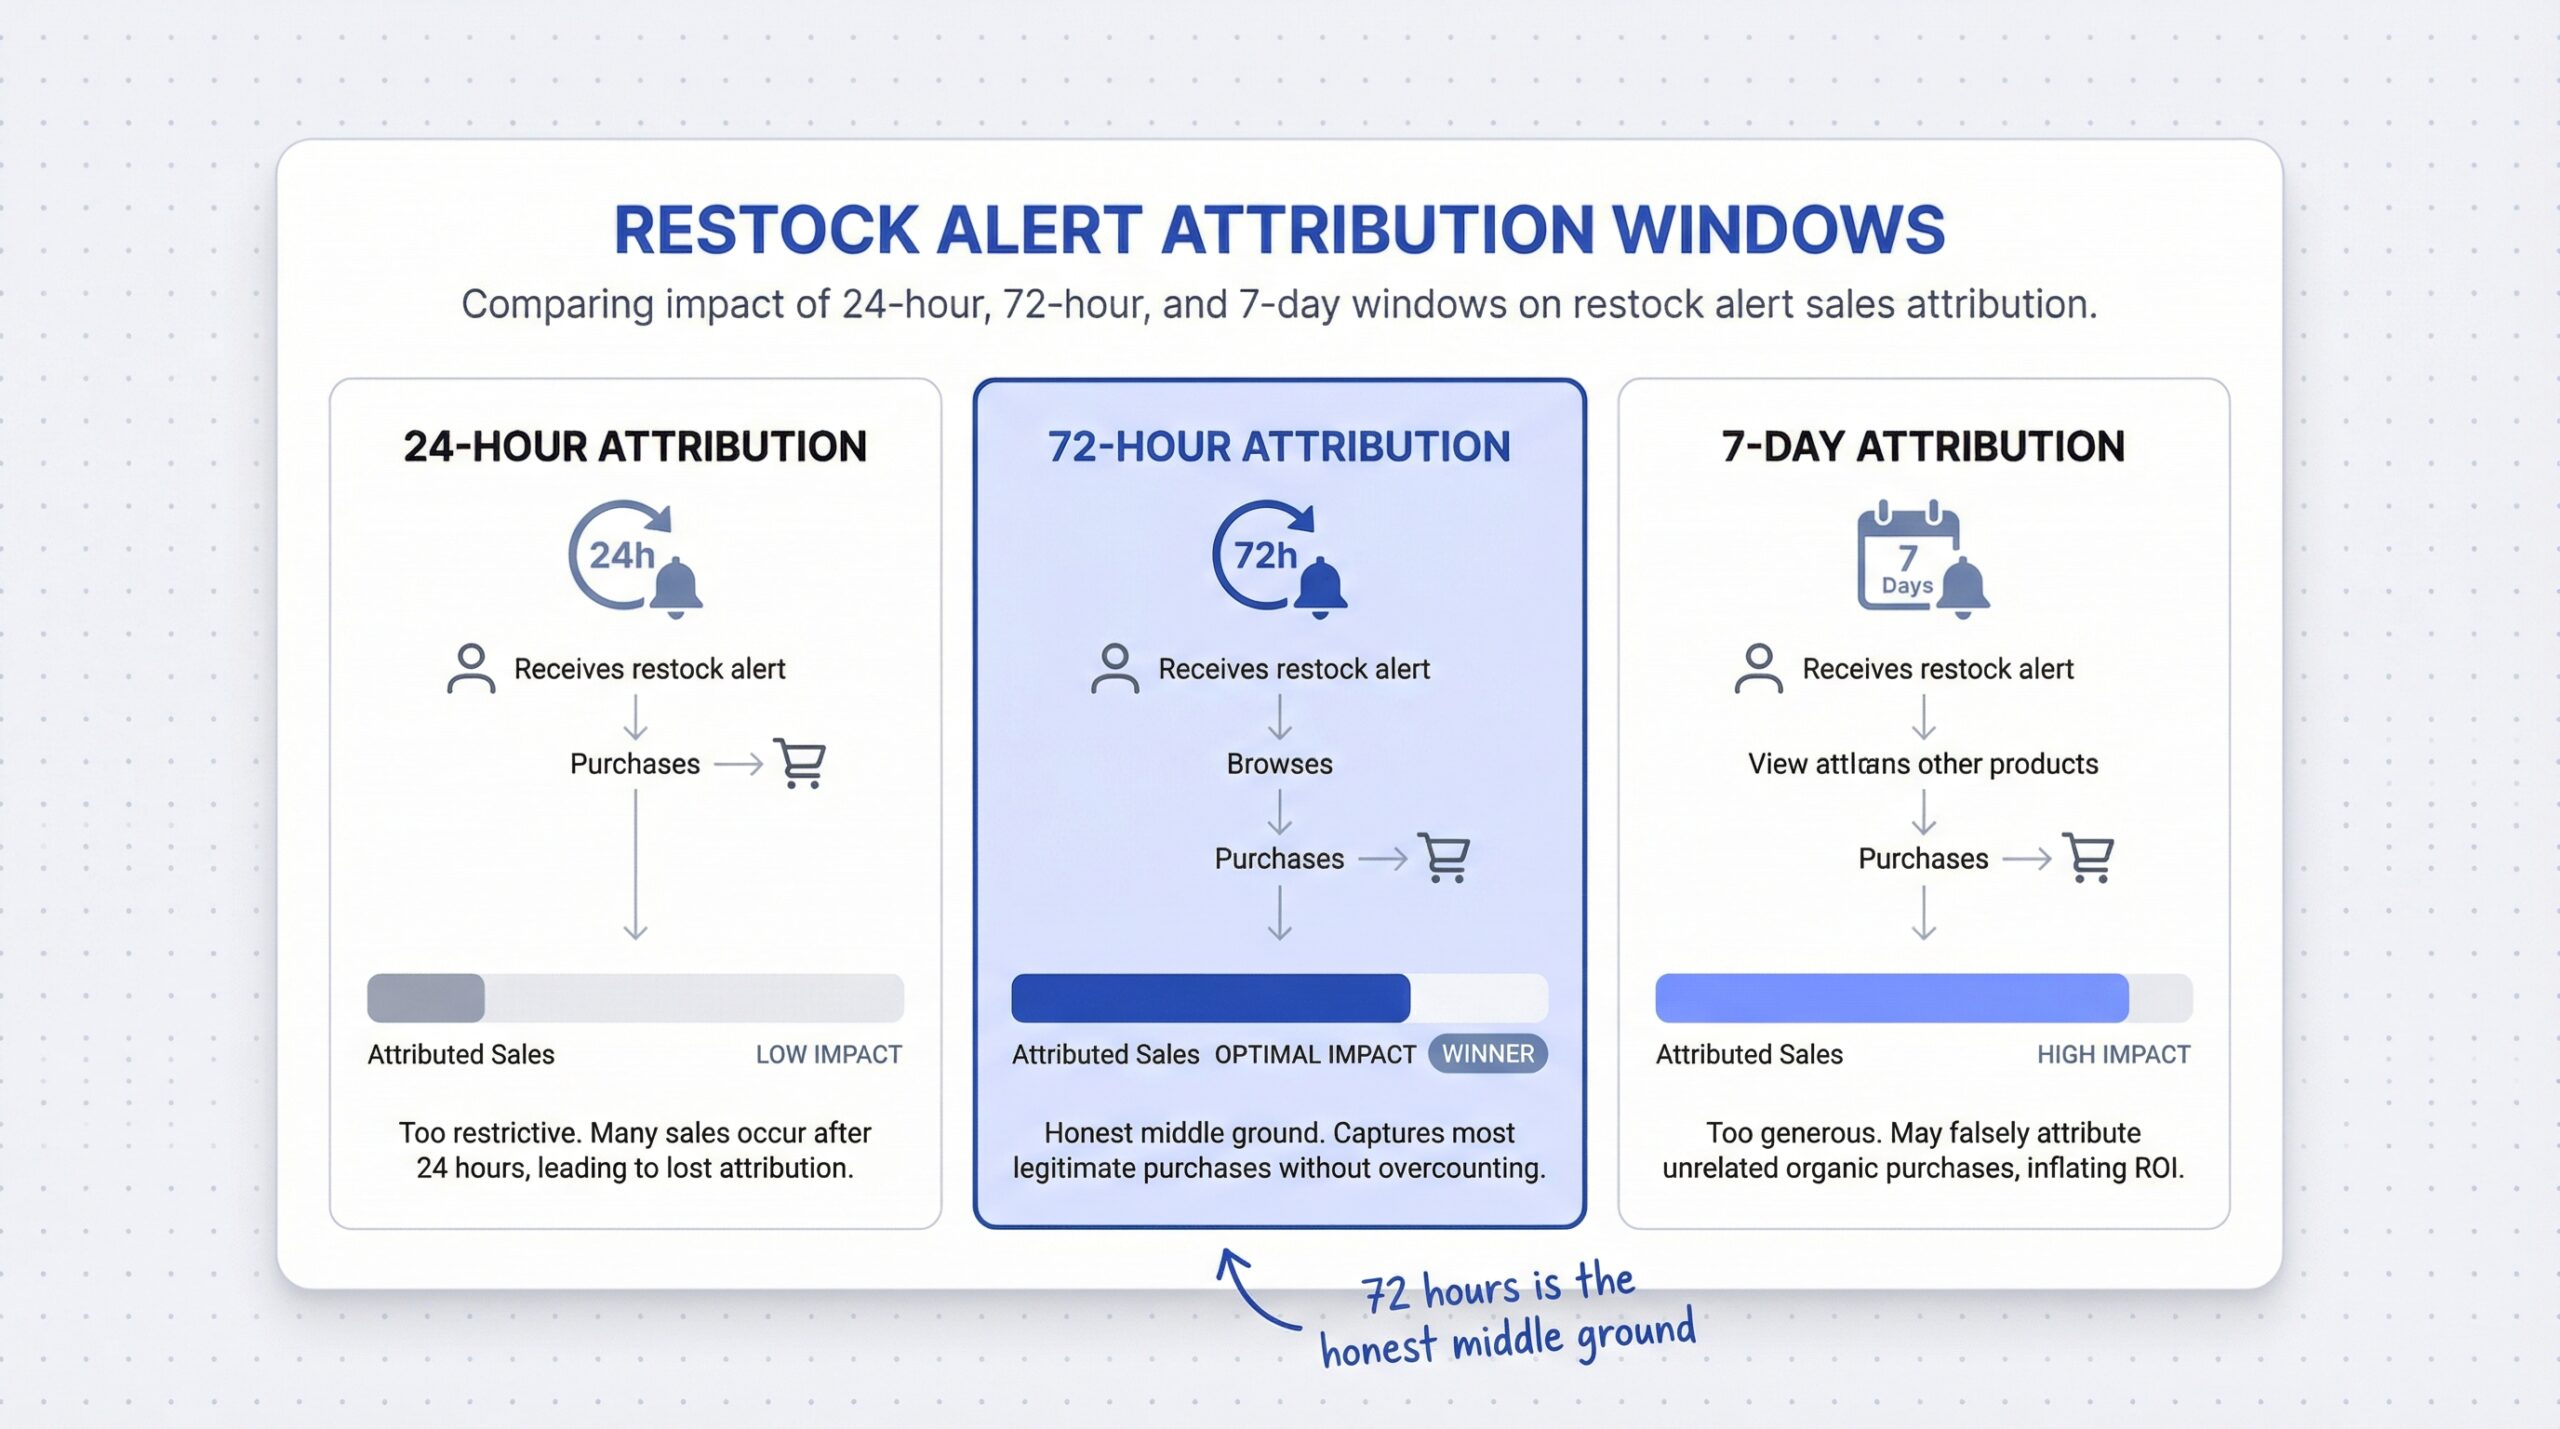
Restock notification revenue attribution is where back in stock revenue recovery on Shopify gets tricky. The attribution window you choose determines which purchases “count” as notification-driven.
24-hour window: Only counts purchases within 24 hours of clicking the alert. This is the most conservative measure. It captures the immediate impulse buyers but misses shoppers who click, compare, and return the next day.
72-hour window: Counts purchases within three days. This is the sweet spot for honest reporting. Most genuine notification-driven purchases happen within this window.
7-day window: Counts any purchase within a week. This inflates your numbers because some of those buyers might have purchased anyway through other channels.
Here is how the same scenario looks under each window:
| Attribution Window | Purchases Attributed | Revenue Reported | Reported ROI |
|---|---|---|---|
| 24-hour | 12 orders | $780 | 2,500% |
| 72-hour | 18 orders | $1,170 | 3,800% |
| 7-day | 25 orders | $1,625 | 5,300% |
Same month. Same alerts. Three very different ROI numbers. Use 72-hour click attribution for your standard reports. It is honest without being punitive. If your app reports a different default, know what window it uses so you can compare fairly.
Here is a concrete walkthrough for a mid-size Shopify store.
Inputs:
| Input | Value |
|---|---|
| Monthly waitlist subscribers | 500 |
| Subscriber-to-purchase rate | 6% |
| Average order value | $65 |
| App cost (monthly) | $19.99 |
| Email platform cost allocation | $10/month |
Calculation:
| Step | Math | Result |
|---|---|---|
| Orders recovered | 500 x 6% | 30 orders |
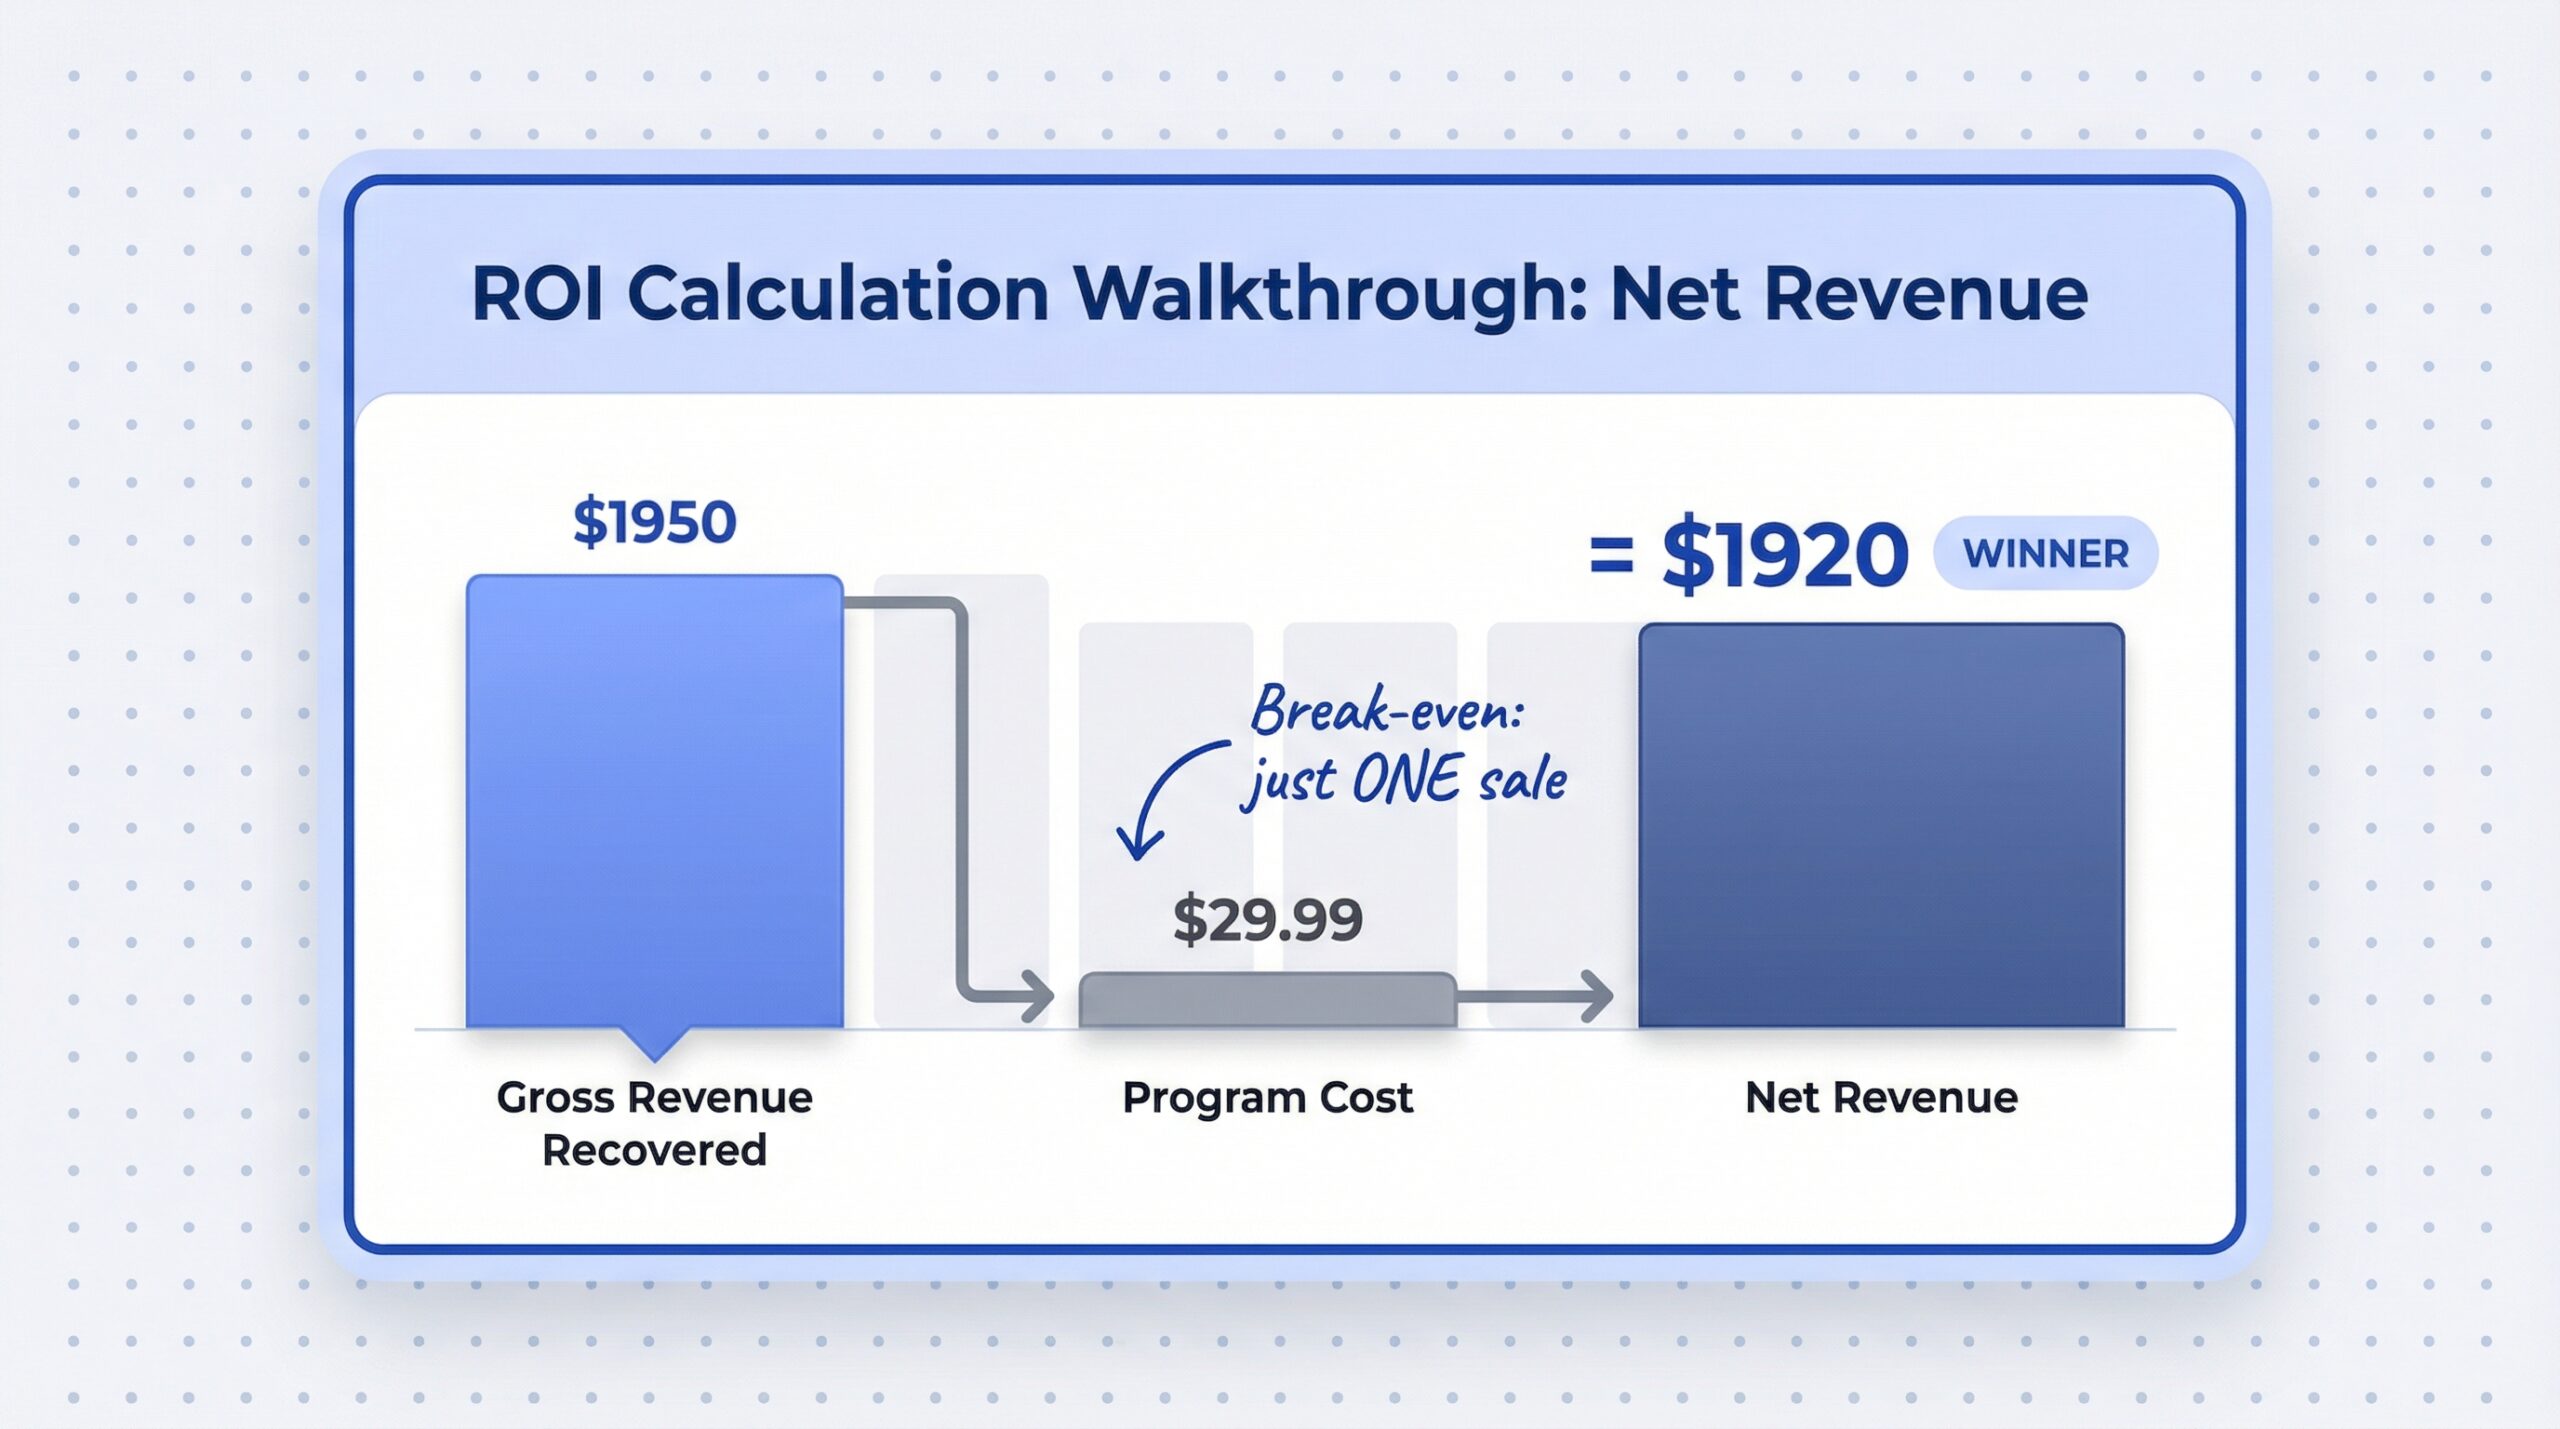
| Gross revenue recovered | 30 x $65 | $1,950 |
| Total program cost | $19.99 + $10 | $29.99 |
| Net revenue | $1,950 – $29.99 | $1,920.01 |
| Net ROI | ($1,920.01 / $29.99) x 100 | 6,402% |
| Revenue per subscriber | $1,950 / 500 | $3.90 |
| Cost per recovered sale | $29.99 / 30 | $1.00 |
A 6,402% ROI is not unusual for email-based back-in-stock programs because the cost base is so low. Email marketing delivers $68 ROI for every $1 spent for US ecommerce businesses (Omnisend, 2025), and back-in-stock alerts outperform the email average.
The break-even point for this store is just one recovered sale per month. As long as one subscriber converts at a $30+ order value, the program pays for itself.
BirkenstockCentral achieved a 22.45% subscriber-to-purchase conversion rate on their back-in-stock program (MarketingSherpa back-in-stock alert case study). At that rate with the same inputs above, they would recover 112 orders and $7,280 in monthly revenue.
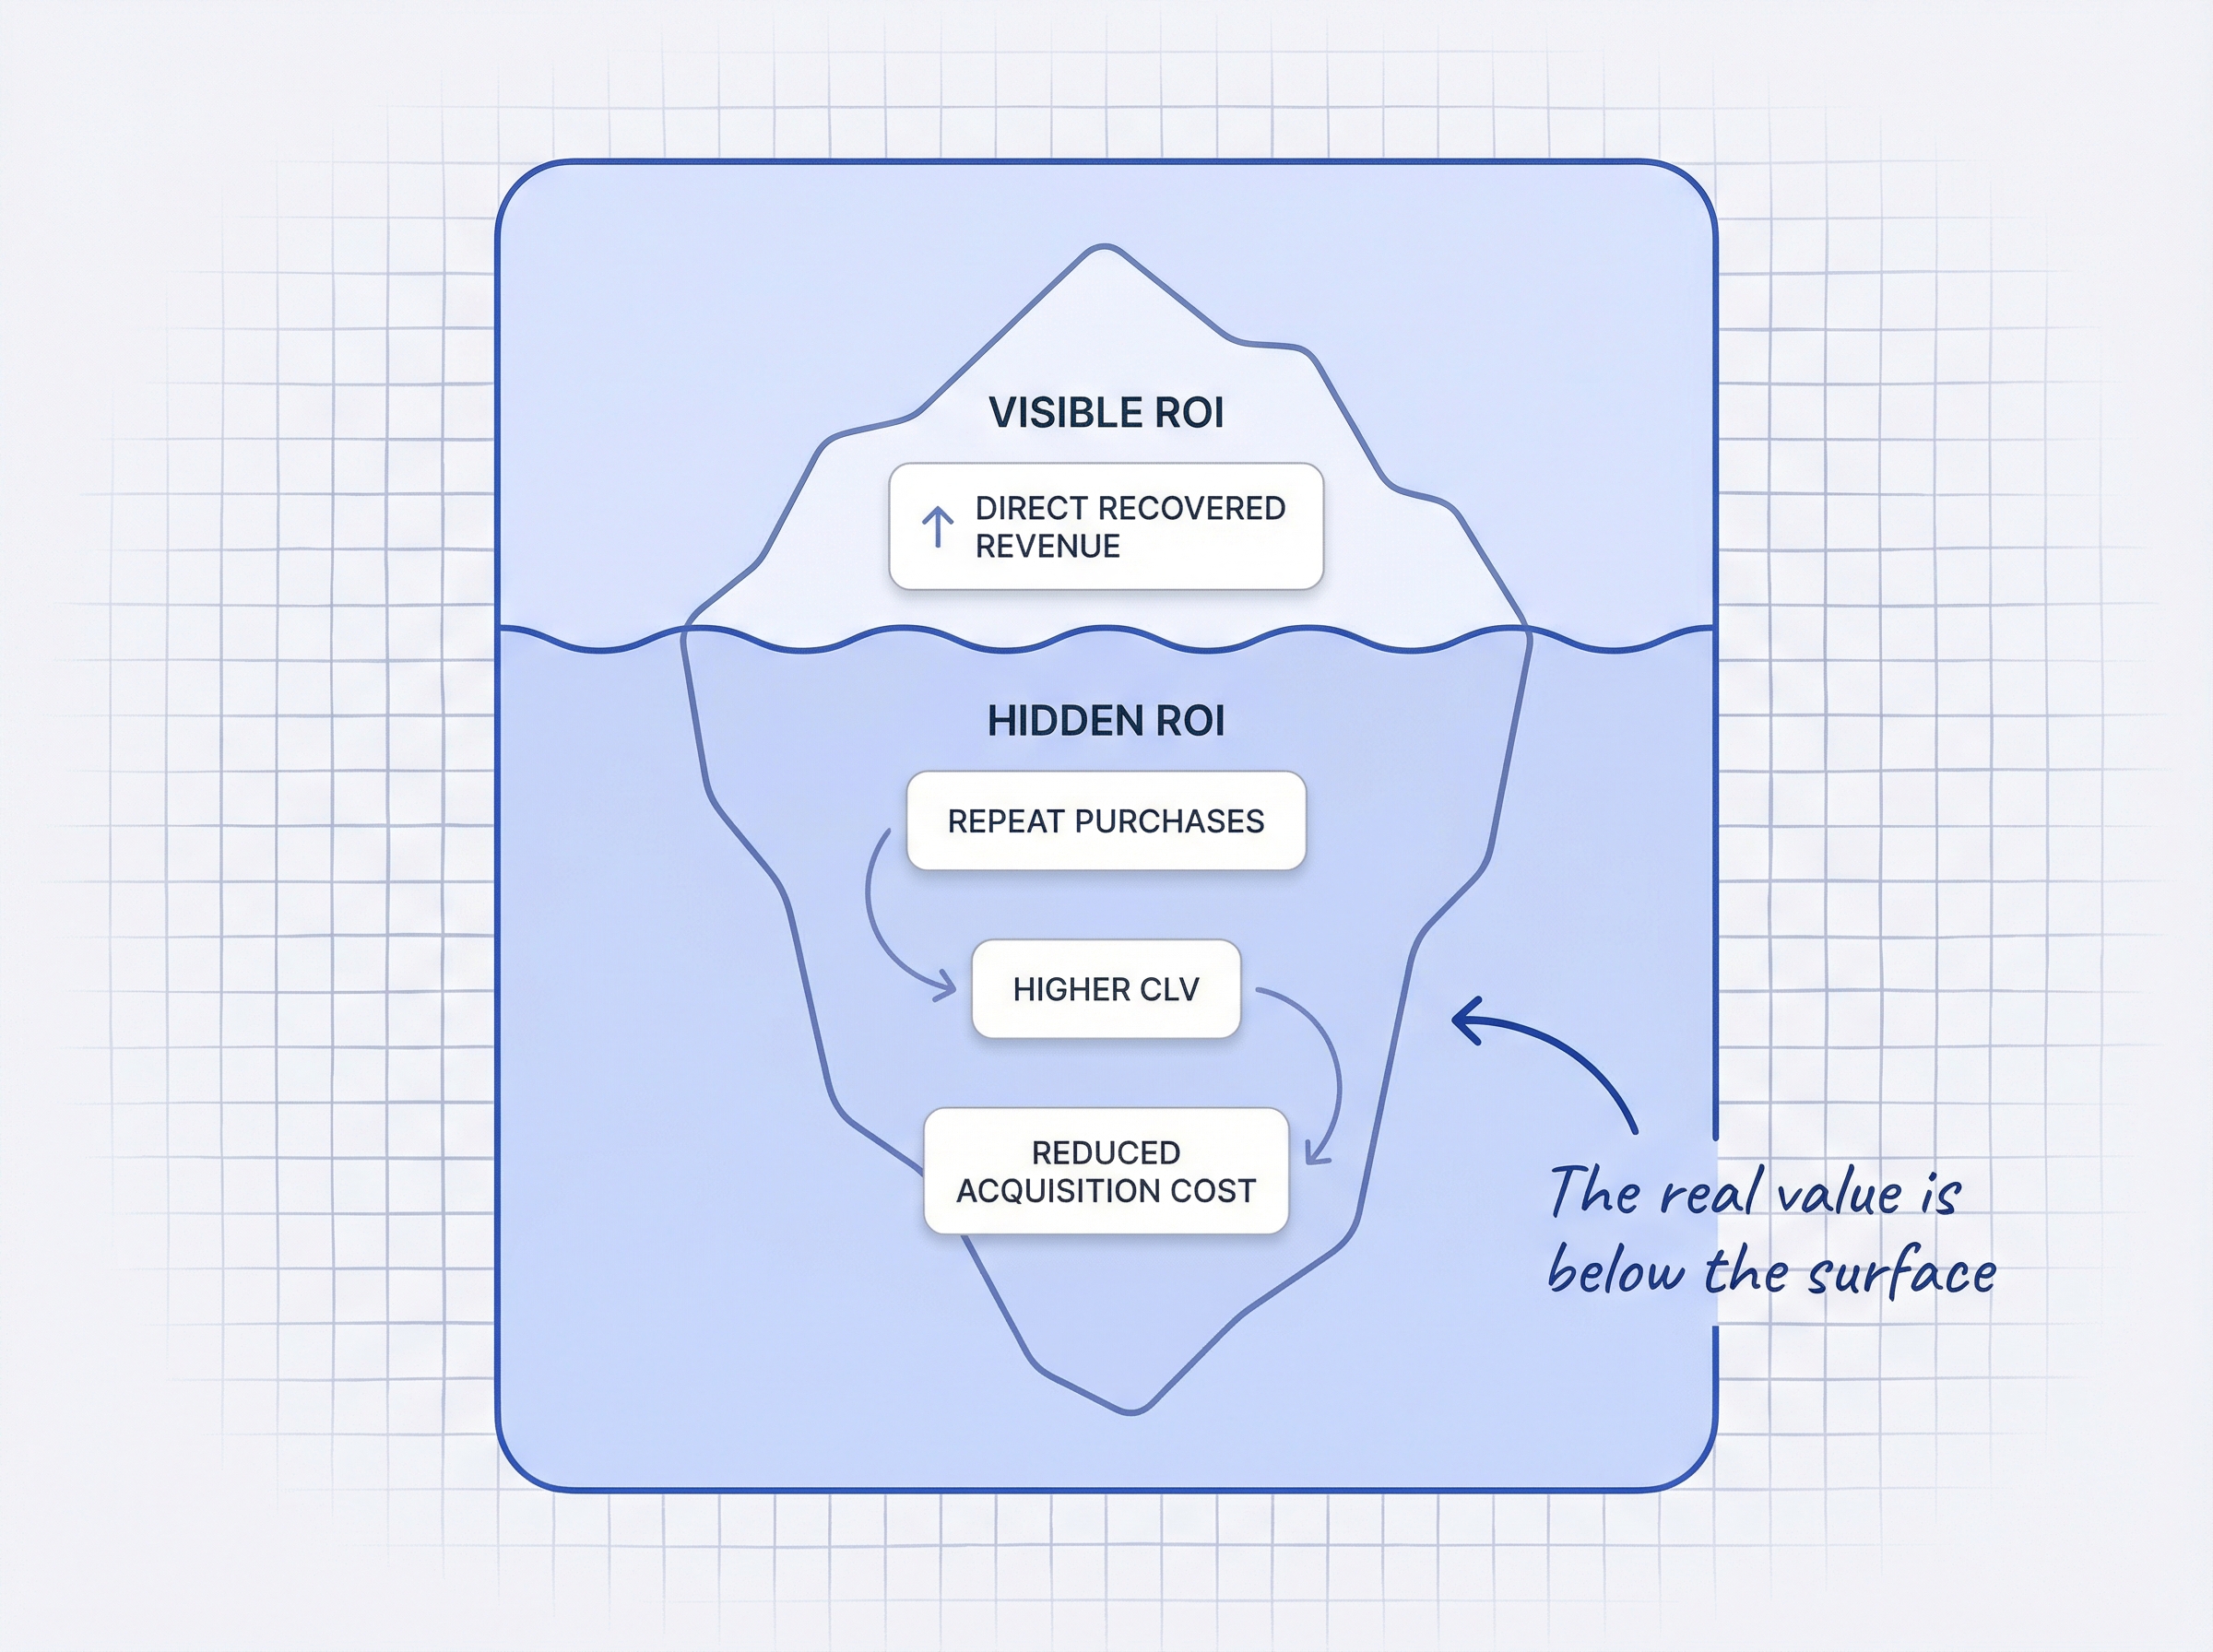
The visible ROI, revenue recovered from restock alerts, understates the true value by 2-3x. Here is why.
Back-in-stock subscribers are repeat buyers. They come back at rates 41% higher than average customers. They already chose your product specifically, waited for it, and completed a purchase. That is the behavioral profile of a loyal customer.
The notification is the first purchase, not the last one. If your AOV is $65 and a subscriber makes 2.5 purchases over their lifetime (once from the alert, 1.5 repeat purchases), their actual value is $162.50, not $65.
This is the back in stock subscriber lifetime value argument. When you report ROI to stakeholders, include a line for projected CLV. Frame it as: “Our notification program recovered $1,950 in direct revenue this month. Based on repeat purchase rates, those 30 customers are worth an estimated $4,875 over the next 12 months.”
That reframes the conversation from “is this $20/month app worth it?” to “is capturing $4,875 in customer lifetime value worth $20?”
We covered what stockouts actually cost your Shopify store in a separate article. Compare your recovered revenue against that cost baseline to show the full picture: what you are losing without alerts versus what you are gaining with them.
Build a monthly one-page report with five lines. That is all you need.
Monthly Back-in-Stock ROI Report:
| Metric | This Month | Last Month | Trend |
|---|---|---|---|
| New waitlist subscribers | 500 | 420 | +19% |
| Restock notifications sent | 380 | 310 | +23% |
| Revenue recovered (72-hour window) | $1,950 | $1,560 | +25% |
| Net ROI | 6,402% | 5,100% | +25% |
| Revenue per subscriber | $3.90 | $3.71 | +5% |
Include one comparison line at the bottom: “Without alerts, 69% of these customers would have purchased from a competitor.” That frames the alternative. The cost of not running the program is losing those customers permanently. You can reference SMS, email, and WhatsApp restock alert channel comparisons to show opportunities for expanding to additional channels.
Your back in stock alerts ROI on Shopify is almost certainly positive. The question is not “should we keep doing this?” It is “how much more should we invest?” A back-in-stock notification app for Shopify with built-in purchase tracking gives you these numbers without manual spreadsheet work. Start measuring, and let the ROI make the case.
What is a good ROI for back-in-stock alerts on Shopify?
Most programs achieve 500-5,000%+ ROI because the cost base is so low (typically $10-30/month for the app). Any store that recovers more than one or two sales per month from restock alerts has a positive ROI. The real variance comes from subscriber volume and average order value.
How do I know which sales came from my back-in-stock alerts?
Use click attribution: count purchases made by customers who clicked a restock notification link within your attribution window (72 hours recommended). Most back-in-stock apps track this automatically through unique UTM parameters or built-in purchase tracking.
What is a good revenue per subscriber for restock alerts?
$2-8 per subscriber is a healthy range for email-based programs. Below $2, your conversion rate or AOV may need attention. Above $8, your program is performing in the top tier. This metric is more useful than total revenue because it normalizes for subscriber volume.
Should I include SMS and WhatsApp costs in my ROI calculation?
Yes. Include all channel-specific costs (SMS per-message fees, WhatsApp Business API costs) in your total program cost. SMS and WhatsApp typically have higher per-send costs but can also drive higher conversion rates, so calculate ROI per channel separately if you use multiple channels.
How long does it take for a back-in-stock program to show ROI?
Most stores see positive ROI within the first month if they have products that regularly go in and out of stock. The break-even point is typically one to three recovered sales, depending on your AOV and app cost. Stores with higher AOV and frequent stockouts see faster returns.
Keep reading